Canadian vs Haitian Median Earnings
COMPARE
Canadian
Haitian
Median Earnings
Median Earnings Comparison
Canadians
Haitians
$47,911
MEDIAN EARNINGS
88.8/ 100
METRIC RATING
139th/ 347
METRIC RANK
$40,918
MEDIAN EARNINGS
0.0/ 100
METRIC RATING
303rd/ 347
METRIC RANK
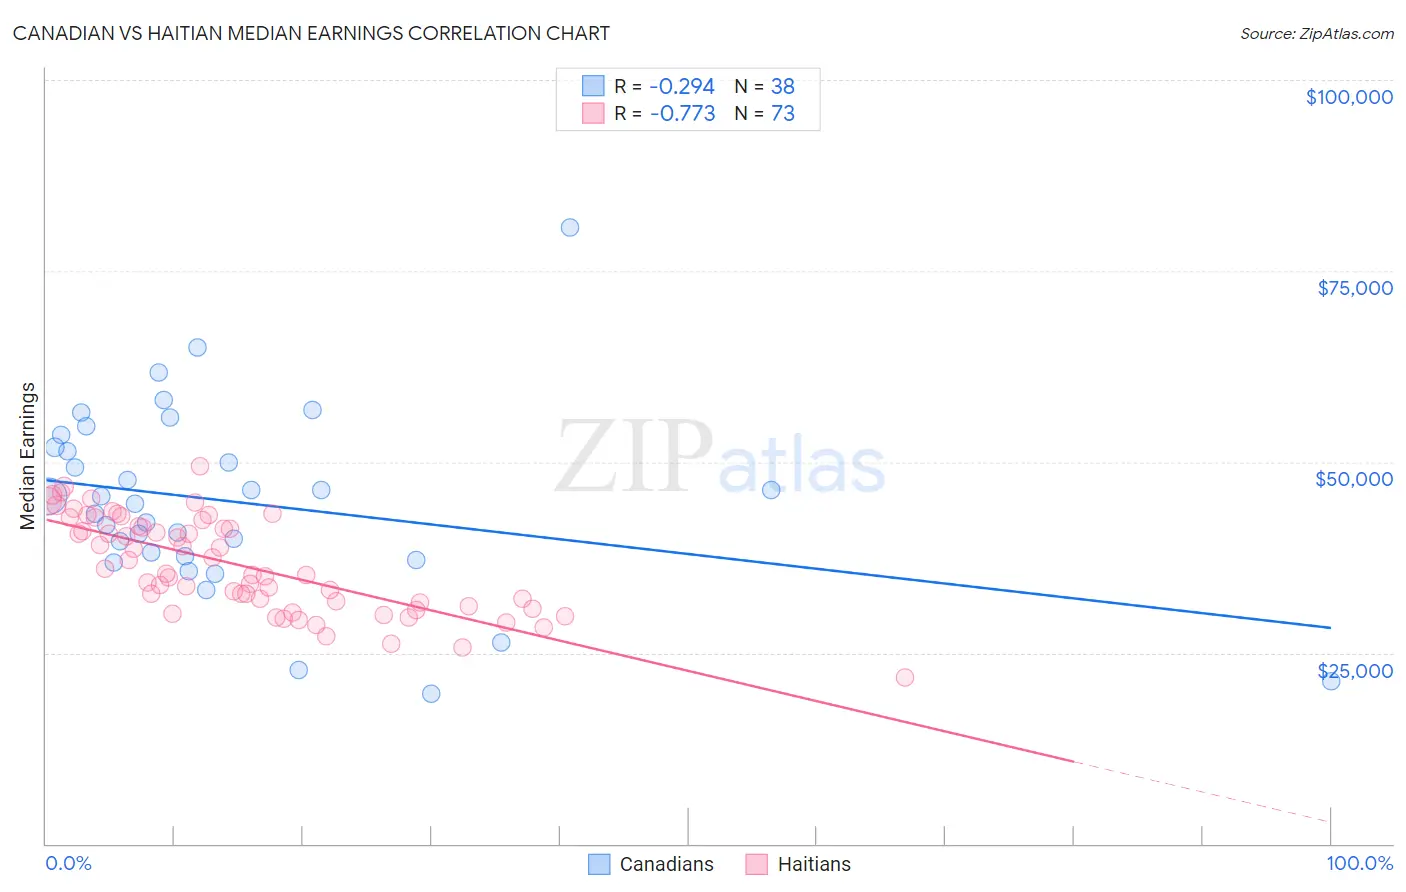
Canadian vs Haitian Median Earnings Correlation Chart
The statistical analysis conducted on geographies consisting of 437,494,547 people shows a weak negative correlation between the proportion of Canadians and median earnings in the United States with a correlation coefficient (R) of -0.294 and weighted average of $47,911. Similarly, the statistical analysis conducted on geographies consisting of 288,009,020 people shows a strong negative correlation between the proportion of Haitians and median earnings in the United States with a correlation coefficient (R) of -0.773 and weighted average of $40,918, a difference of 17.1%.
Median Earnings Correlation Summary
| Measurement | Canadian | Haitian |
| Minimum | $19,688 | $21,741 |
| Maximum | $80,682 | $49,370 |
| Range | $60,994 | $27,629 |
| Mean | $44,712 | $36,539 |
| Median | $44,948 | $35,319 |
| Interquartile 25% (IQ1) | $37,642 | $31,314 |
| Interquartile 75% (IQ3) | $51,935 | $41,959 |
| Interquartile Range (IQR) | $14,293 | $10,645 |
| Standard Deviation (Sample) | $12,220 | $6,179 |
| Standard Deviation (Population) | $12,058 | $6,136 |
Similar Demographics by Median Earnings
Demographics Similar to Canadians by Median Earnings
In terms of median earnings, the demographic groups most similar to Canadians are European ($47,915, a difference of 0.010%), Taiwanese ($47,902, a difference of 0.020%), Immigrants from Nepal ($47,925, a difference of 0.030%), Immigrants from Sierra Leone ($47,875, a difference of 0.080%), and Ugandan ($47,854, a difference of 0.12%).
| Demographics | Rating | Rank | Median Earnings |
| British | 92.2 /100 | #132 | Exceptional $48,189 |
| Immigrants | Uganda | 90.5 /100 | #133 | Exceptional $48,041 |
| Sri Lankans | 90.5 /100 | #134 | Exceptional $48,040 |
| Portuguese | 90.4 /100 | #135 | Exceptional $48,032 |
| Slovenes | 90.0 /100 | #136 | Excellent $47,995 |
| Immigrants | Nepal | 89.0 /100 | #137 | Excellent $47,925 |
| Europeans | 88.9 /100 | #138 | Excellent $47,915 |
| Canadians | 88.8 /100 | #139 | Excellent $47,911 |
| Taiwanese | 88.7 /100 | #140 | Excellent $47,902 |
| Immigrants | Sierra Leone | 88.3 /100 | #141 | Excellent $47,875 |
| Ugandans | 88.0 /100 | #142 | Excellent $47,854 |
| Swedes | 88.0 /100 | #143 | Excellent $47,851 |
| Hungarians | 87.1 /100 | #144 | Excellent $47,795 |
| Immigrants | Saudi Arabia | 85.6 /100 | #145 | Excellent $47,704 |
| Immigrants | Chile | 85.5 /100 | #146 | Excellent $47,697 |
Demographics Similar to Haitians by Median Earnings
In terms of median earnings, the demographic groups most similar to Haitians are Shoshone ($40,932, a difference of 0.030%), Immigrants from Guatemala ($40,851, a difference of 0.16%), Ute ($41,051, a difference of 0.32%), Immigrants from Latin America ($41,049, a difference of 0.32%), and Immigrants from Caribbean ($41,119, a difference of 0.49%).
| Demographics | Rating | Rank | Median Earnings |
| Cherokee | 0.1 /100 | #296 | Tragic $41,252 |
| Guatemalans | 0.1 /100 | #297 | Tragic $41,205 |
| Immigrants | Micronesia | 0.1 /100 | #298 | Tragic $41,133 |
| Immigrants | Caribbean | 0.1 /100 | #299 | Tragic $41,119 |
| Ute | 0.1 /100 | #300 | Tragic $41,051 |
| Immigrants | Latin America | 0.1 /100 | #301 | Tragic $41,049 |
| Shoshone | 0.0 /100 | #302 | Tragic $40,932 |
| Haitians | 0.0 /100 | #303 | Tragic $40,918 |
| Immigrants | Guatemala | 0.0 /100 | #304 | Tragic $40,851 |
| Chickasaw | 0.0 /100 | #305 | Tragic $40,672 |
| Yaqui | 0.0 /100 | #306 | Tragic $40,647 |
| Hondurans | 0.0 /100 | #307 | Tragic $40,638 |
| Cubans | 0.0 /100 | #308 | Tragic $40,619 |
| Immigrants | Haiti | 0.0 /100 | #309 | Tragic $40,550 |
| Apache | 0.0 /100 | #310 | Tragic $40,388 |