Nonimmigrants vs Menominee Median Earnings
COMPARE
Nonimmigrants
Menominee
Median Earnings
Median Earnings Comparison
Nonimmigrants
Menominee
$44,117
MEDIAN EARNINGS
3.7/ 100
METRIC RATING
244th/ 347
METRIC RANK
$37,884
MEDIAN EARNINGS
0.0/ 100
METRIC RATING
339th/ 347
METRIC RANK
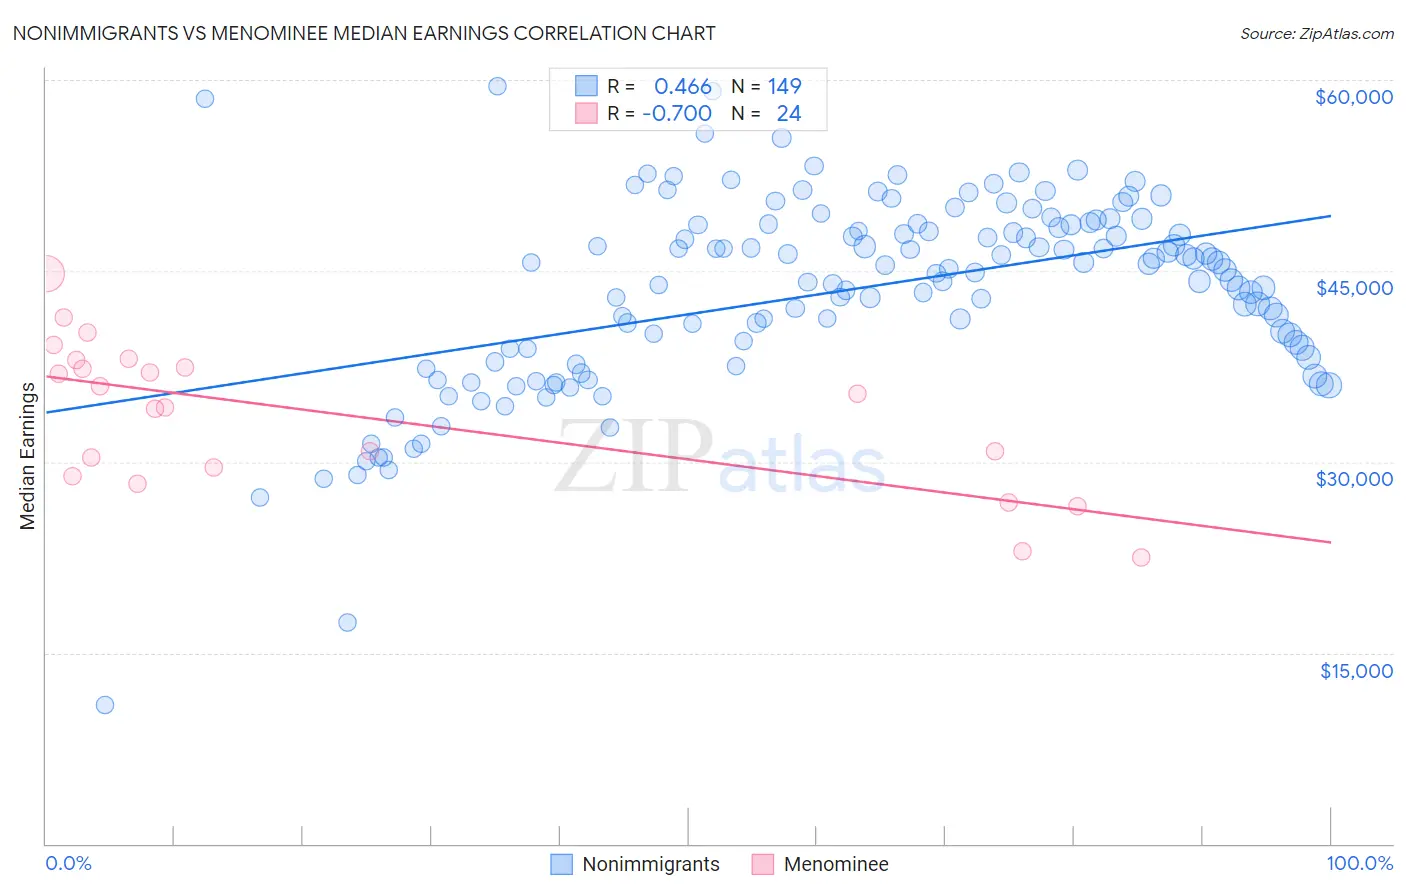
Nonimmigrants vs Menominee Median Earnings Correlation Chart
The statistical analysis conducted on geographies consisting of 583,813,496 people shows a moderate positive correlation between the proportion of Nonimmigrants and median earnings in the United States with a correlation coefficient (R) of 0.466 and weighted average of $44,117. Similarly, the statistical analysis conducted on geographies consisting of 45,778,612 people shows a strong negative correlation between the proportion of Menominee and median earnings in the United States with a correlation coefficient (R) of -0.700 and weighted average of $37,884, a difference of 16.5%.
Median Earnings Correlation Summary
| Measurement | Nonimmigrants | Menominee |
| Minimum | $10,941 | $22,480 |
| Maximum | $59,517 | $44,793 |
| Range | $48,576 | $22,313 |
| Mean | $43,445 | $33,658 |
| Median | $45,090 | $34,813 |
| Interquartile 25% (IQ1) | $38,540 | $29,201 |
| Interquartile 75% (IQ3) | $48,620 | $37,722 |
| Interquartile Range (IQR) | $10,080 | $8,521 |
| Standard Deviation (Sample) | $7,587 | $5,845 |
| Standard Deviation (Population) | $7,562 | $5,722 |
Similar Demographics by Median Earnings
Demographics Similar to Nonimmigrants by Median Earnings
In terms of median earnings, the demographic groups most similar to Nonimmigrants are Subsaharan African ($44,118, a difference of 0.0%), Immigrants from Venezuela ($44,163, a difference of 0.10%), Samoan ($44,206, a difference of 0.20%), Immigrants from Burma/Myanmar ($43,998, a difference of 0.27%), and Aleut ($44,241, a difference of 0.28%).
| Demographics | Rating | Rank | Median Earnings |
| Immigrants | Ecuador | 5.9 /100 | #237 | Tragic $44,462 |
| Sudanese | 5.6 /100 | #238 | Tragic $44,419 |
| Senegalese | 5.3 /100 | #239 | Tragic $44,373 |
| Aleuts | 4.4 /100 | #240 | Tragic $44,241 |
| Samoans | 4.2 /100 | #241 | Tragic $44,206 |
| Immigrants | Venezuela | 4.0 /100 | #242 | Tragic $44,163 |
| Sub-Saharan Africans | 3.7 /100 | #243 | Tragic $44,118 |
| Immigrants | Nonimmigrants | 3.7 /100 | #244 | Tragic $44,117 |
| Immigrants | Burma/Myanmar | 3.2 /100 | #245 | Tragic $43,998 |
| Immigrants | West Indies | 3.1 /100 | #246 | Tragic $43,989 |
| Immigrants | Cabo Verde | 3.0 /100 | #247 | Tragic $43,963 |
| Nepalese | 2.6 /100 | #248 | Tragic $43,860 |
| Malaysians | 2.6 /100 | #249 | Tragic $43,844 |
| Alaska Natives | 2.3 /100 | #250 | Tragic $43,750 |
| Tsimshian | 2.1 /100 | #251 | Tragic $43,695 |
Demographics Similar to Menominee by Median Earnings
In terms of median earnings, the demographic groups most similar to Menominee are Pima ($38,285, a difference of 1.1%), Immigrants from Cuba ($38,426, a difference of 1.4%), Crow ($38,707, a difference of 2.2%), Navajo ($36,999, a difference of 2.4%), and Native/Alaskan ($38,896, a difference of 2.7%).
| Demographics | Rating | Rank | Median Earnings |
| Yakama | 0.0 /100 | #332 | Tragic $39,107 |
| Houma | 0.0 /100 | #333 | Tragic $38,949 |
| Spanish American Indians | 0.0 /100 | #334 | Tragic $38,907 |
| Natives/Alaskans | 0.0 /100 | #335 | Tragic $38,896 |
| Crow | 0.0 /100 | #336 | Tragic $38,707 |
| Immigrants | Cuba | 0.0 /100 | #337 | Tragic $38,426 |
| Pima | 0.0 /100 | #338 | Tragic $38,285 |
| Menominee | 0.0 /100 | #339 | Tragic $37,884 |
| Navajo | 0.0 /100 | #340 | Tragic $36,999 |
| Lumbee | 0.0 /100 | #341 | Tragic $36,876 |
| Hopi | 0.0 /100 | #342 | Tragic $36,871 |
| Pueblo | 0.0 /100 | #343 | Tragic $36,859 |
| Arapaho | 0.0 /100 | #344 | Tragic $36,586 |
| Tohono O'odham | 0.0 /100 | #345 | Tragic $36,349 |
| Yup'ik | 0.0 /100 | #346 | Tragic $35,942 |