Canadian vs Arab Median Earnings
COMPARE
Canadian
Arab
Median Earnings
Median Earnings Comparison
Canadians
Arabs
$47,911
MEDIAN EARNINGS
88.8/ 100
METRIC RATING
139th/ 347
METRIC RANK
$48,599
MEDIAN EARNINGS
95.4/ 100
METRIC RATING
121st/ 347
METRIC RANK
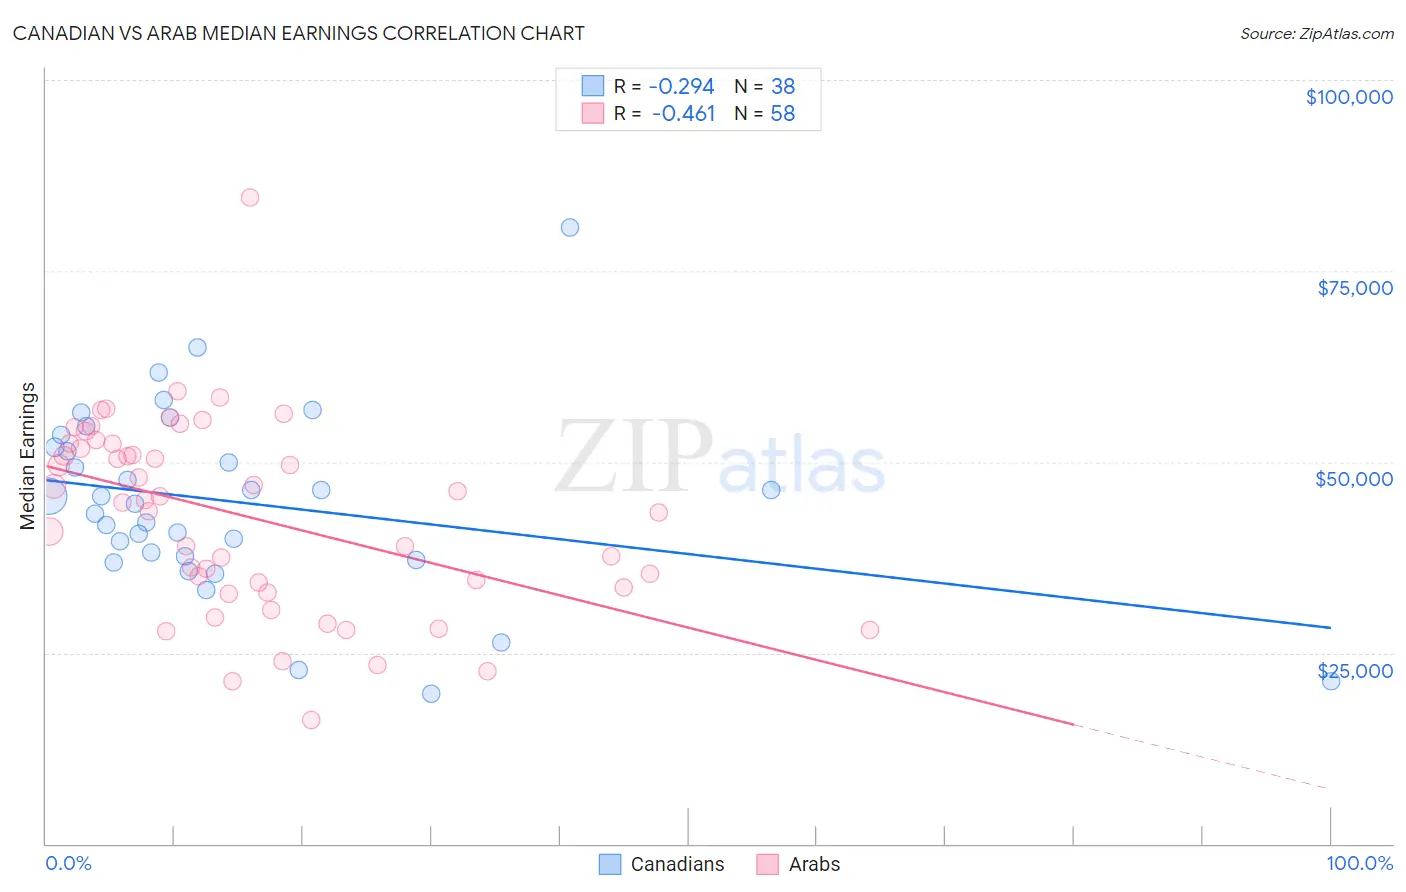
Canadian vs Arab Median Earnings Correlation Chart
The statistical analysis conducted on geographies consisting of 437,494,547 people shows a weak negative correlation between the proportion of Canadians and median earnings in the United States with a correlation coefficient (R) of -0.294 and weighted average of $47,911. Similarly, the statistical analysis conducted on geographies consisting of 486,850,484 people shows a moderate negative correlation between the proportion of Arabs and median earnings in the United States with a correlation coefficient (R) of -0.461 and weighted average of $48,599, a difference of 1.4%.
Median Earnings Correlation Summary
| Measurement | Canadian | Arab |
| Minimum | $19,688 | $16,192 |
| Maximum | $80,682 | $84,560 |
| Range | $60,994 | $68,368 |
| Mean | $44,712 | $42,864 |
| Median | $44,948 | $44,810 |
| Interquartile 25% (IQ1) | $37,642 | $33,563 |
| Interquartile 75% (IQ3) | $51,935 | $52,424 |
| Interquartile Range (IQR) | $14,293 | $18,861 |
| Standard Deviation (Sample) | $12,220 | $12,577 |
| Standard Deviation (Population) | $12,058 | $12,468 |
Demographics Similar to Canadians and Arabs by Median Earnings
In terms of median earnings, the demographic groups most similar to Canadians are European ($47,915, a difference of 0.010%), Taiwanese ($47,902, a difference of 0.020%), Immigrants from Nepal ($47,925, a difference of 0.030%), Slovene ($47,995, a difference of 0.18%), and Portuguese ($48,032, a difference of 0.25%). Similarly, the demographic groups most similar to Arabs are Carpatho Rusyn ($48,617, a difference of 0.040%), Chilean ($48,504, a difference of 0.19%), Immigrants from Syria ($48,375, a difference of 0.46%), Brazilian ($48,356, a difference of 0.50%), and Immigrants from Fiji ($48,305, a difference of 0.61%).
| Demographics | Rating | Rank | Median Earnings |
| Carpatho Rusyns | 95.5 /100 | #120 | Exceptional $48,617 |
| Arabs | 95.4 /100 | #121 | Exceptional $48,599 |
| Chileans | 94.8 /100 | #122 | Exceptional $48,504 |
| Immigrants | Syria | 93.9 /100 | #123 | Exceptional $48,375 |
| Brazilians | 93.7 /100 | #124 | Exceptional $48,356 |
| Immigrants | Fiji | 93.3 /100 | #125 | Exceptional $48,305 |
| Assyrians/Chaldeans/Syriacs | 93.3 /100 | #126 | Exceptional $48,304 |
| Sierra Leoneans | 93.1 /100 | #127 | Exceptional $48,286 |
| Immigrants | Philippines | 92.9 /100 | #128 | Exceptional $48,266 |
| Pakistanis | 92.8 /100 | #129 | Exceptional $48,254 |
| Zimbabweans | 92.6 /100 | #130 | Exceptional $48,229 |
| Lebanese | 92.5 /100 | #131 | Exceptional $48,226 |
| British | 92.2 /100 | #132 | Exceptional $48,189 |
| Immigrants | Uganda | 90.5 /100 | #133 | Exceptional $48,041 |
| Sri Lankans | 90.5 /100 | #134 | Exceptional $48,040 |
| Portuguese | 90.4 /100 | #135 | Exceptional $48,032 |
| Slovenes | 90.0 /100 | #136 | Excellent $47,995 |
| Immigrants | Nepal | 89.0 /100 | #137 | Excellent $47,925 |
| Europeans | 88.9 /100 | #138 | Excellent $47,915 |
| Canadians | 88.8 /100 | #139 | Excellent $47,911 |
| Taiwanese | 88.7 /100 | #140 | Excellent $47,902 |