Immigrants from South America vs Menominee Median Earnings
COMPARE
Immigrants from South America
Menominee
Median Earnings
Median Earnings Comparison
Immigrants from South America
Menominee
$46,548
MEDIAN EARNINGS
54.0/ 100
METRIC RATING
169th/ 347
METRIC RANK
$37,884
MEDIAN EARNINGS
0.0/ 100
METRIC RATING
339th/ 347
METRIC RANK
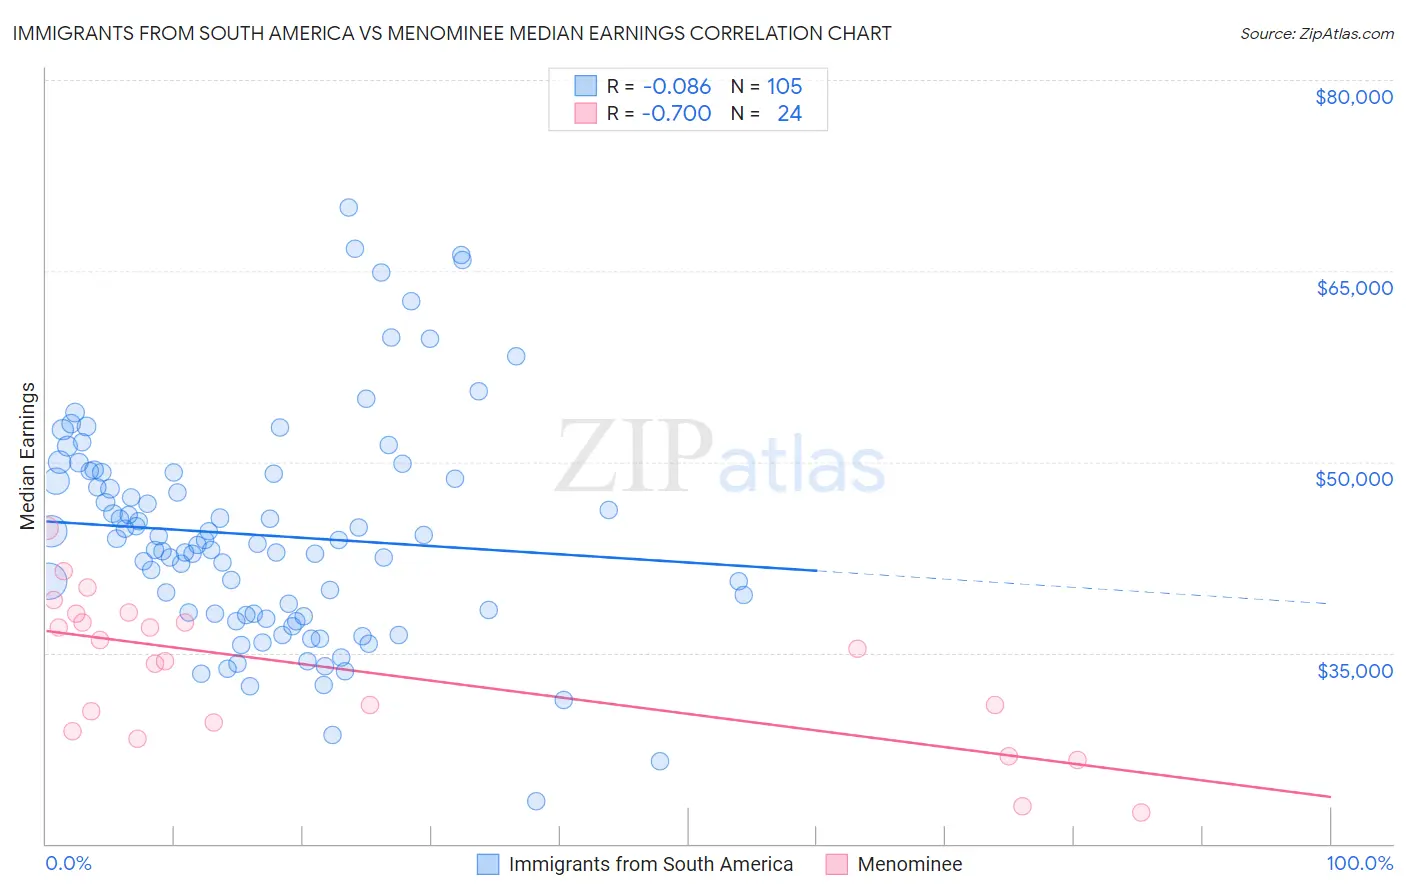
Immigrants from South America vs Menominee Median Earnings Correlation Chart
The statistical analysis conducted on geographies consisting of 486,376,304 people shows a slight negative correlation between the proportion of Immigrants from South America and median earnings in the United States with a correlation coefficient (R) of -0.086 and weighted average of $46,548. Similarly, the statistical analysis conducted on geographies consisting of 45,778,612 people shows a strong negative correlation between the proportion of Menominee and median earnings in the United States with a correlation coefficient (R) of -0.700 and weighted average of $37,884, a difference of 22.9%.
Median Earnings Correlation Summary
| Measurement | Immigrants from South America | Menominee |
| Minimum | $23,314 | $22,480 |
| Maximum | $70,000 | $44,793 |
| Range | $46,686 | $22,313 |
| Mean | $44,228 | $33,658 |
| Median | $43,615 | $34,813 |
| Interquartile 25% (IQ1) | $37,956 | $29,201 |
| Interquartile 75% (IQ3) | $49,134 | $37,722 |
| Interquartile Range (IQR) | $11,178 | $8,521 |
| Standard Deviation (Sample) | $8,760 | $5,845 |
| Standard Deviation (Population) | $8,718 | $5,722 |
Similar Demographics by Median Earnings
Demographics Similar to Immigrants from South America by Median Earnings
In terms of median earnings, the demographic groups most similar to Immigrants from South America are Immigrants from Africa ($46,564, a difference of 0.030%), Immigrants ($46,478, a difference of 0.15%), Scottish ($46,463, a difference of 0.18%), Kenyan ($46,462, a difference of 0.18%), and Costa Rican ($46,645, a difference of 0.21%).
| Demographics | Rating | Rank | Median Earnings |
| South American Indians | 67.4 /100 | #162 | Good $46,952 |
| Icelanders | 66.3 /100 | #163 | Good $46,916 |
| Norwegians | 64.7 /100 | #164 | Good $46,865 |
| South Americans | 62.7 /100 | #165 | Good $46,804 |
| Czechoslovakians | 57.8 /100 | #166 | Average $46,658 |
| Costa Ricans | 57.4 /100 | #167 | Average $46,645 |
| Immigrants | Africa | 54.6 /100 | #168 | Average $46,564 |
| Immigrants | South America | 54.0 /100 | #169 | Average $46,548 |
| Immigrants | Immigrants | 51.6 /100 | #170 | Average $46,478 |
| Scottish | 51.1 /100 | #171 | Average $46,463 |
| Kenyans | 51.0 /100 | #172 | Average $46,462 |
| Ghanaians | 50.3 /100 | #173 | Average $46,440 |
| Scandinavians | 50.0 /100 | #174 | Average $46,433 |
| Basques | 48.8 /100 | #175 | Average $46,399 |
| Danes | 48.6 /100 | #176 | Average $46,392 |
Demographics Similar to Menominee by Median Earnings
In terms of median earnings, the demographic groups most similar to Menominee are Pima ($38,285, a difference of 1.1%), Immigrants from Cuba ($38,426, a difference of 1.4%), Crow ($38,707, a difference of 2.2%), Navajo ($36,999, a difference of 2.4%), and Native/Alaskan ($38,896, a difference of 2.7%).
| Demographics | Rating | Rank | Median Earnings |
| Yakama | 0.0 /100 | #332 | Tragic $39,107 |
| Houma | 0.0 /100 | #333 | Tragic $38,949 |
| Spanish American Indians | 0.0 /100 | #334 | Tragic $38,907 |
| Natives/Alaskans | 0.0 /100 | #335 | Tragic $38,896 |
| Crow | 0.0 /100 | #336 | Tragic $38,707 |
| Immigrants | Cuba | 0.0 /100 | #337 | Tragic $38,426 |
| Pima | 0.0 /100 | #338 | Tragic $38,285 |
| Menominee | 0.0 /100 | #339 | Tragic $37,884 |
| Navajo | 0.0 /100 | #340 | Tragic $36,999 |
| Lumbee | 0.0 /100 | #341 | Tragic $36,876 |
| Hopi | 0.0 /100 | #342 | Tragic $36,871 |
| Pueblo | 0.0 /100 | #343 | Tragic $36,859 |
| Arapaho | 0.0 /100 | #344 | Tragic $36,586 |
| Tohono O'odham | 0.0 /100 | #345 | Tragic $36,349 |
| Yup'ik | 0.0 /100 | #346 | Tragic $35,942 |