Bhutanese vs Thai Median Female Earnings
COMPARE
Bhutanese
Thai
Median Female Earnings
Median Female Earnings Comparison
Bhutanese
Thais
$43,648
MEDIAN FEMALE EARNINGS
100.0/ 100
METRIC RATING
41st/ 347
METRIC RANK
$47,577
MEDIAN FEMALE EARNINGS
100.0/ 100
METRIC RATING
7th/ 347
METRIC RANK
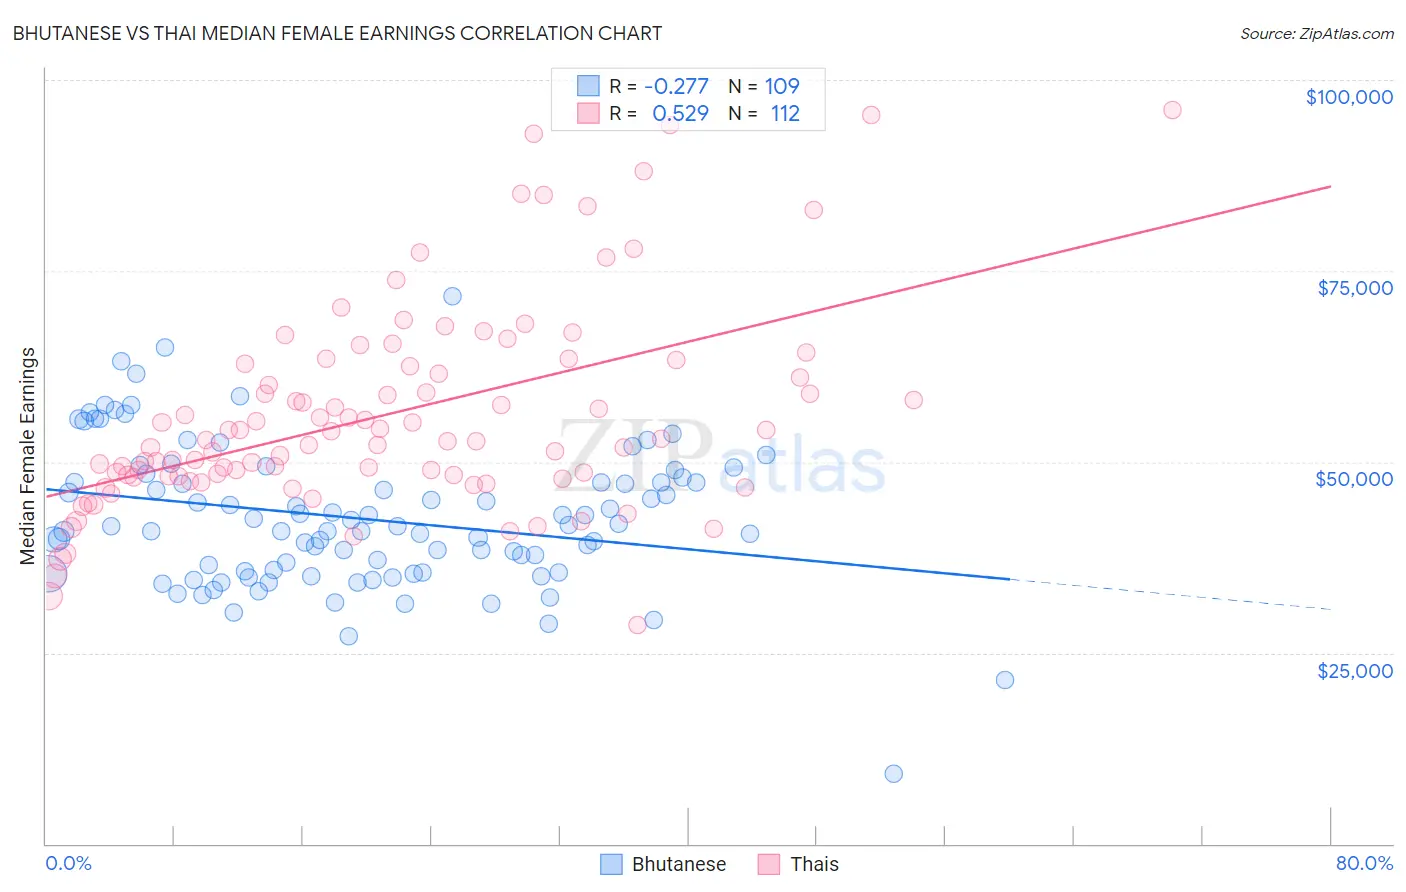
Bhutanese vs Thai Median Female Earnings Correlation Chart
The statistical analysis conducted on geographies consisting of 455,317,651 people shows a weak negative correlation between the proportion of Bhutanese and median female earnings in the United States with a correlation coefficient (R) of -0.277 and weighted average of $43,648. Similarly, the statistical analysis conducted on geographies consisting of 475,636,214 people shows a substantial positive correlation between the proportion of Thais and median female earnings in the United States with a correlation coefficient (R) of 0.529 and weighted average of $47,577, a difference of 9.0%.
Median Female Earnings Correlation Summary
| Measurement | Bhutanese | Thai |
| Minimum | $9,128 | $28,625 |
| Maximum | $71,714 | $96,063 |
| Range | $62,586 | $67,438 |
| Mean | $42,541 | $56,190 |
| Median | $41,499 | $52,820 |
| Interquartile 25% (IQ1) | $35,543 | $48,126 |
| Interquartile 75% (IQ3) | $47,695 | $62,651 |
| Interquartile Range (IQR) | $12,153 | $14,524 |
| Standard Deviation (Sample) | $9,433 | $13,471 |
| Standard Deviation (Population) | $9,390 | $13,411 |
Similar Demographics by Median Female Earnings
Demographics Similar to Bhutanese by Median Female Earnings
In terms of median female earnings, the demographic groups most similar to Bhutanese are Immigrants from Denmark ($43,646, a difference of 0.0%), Bulgarian ($43,638, a difference of 0.020%), Immigrants from Czechoslovakia ($43,571, a difference of 0.18%), Immigrants from Europe ($43,523, a difference of 0.29%), and Immigrants from Bolivia ($43,467, a difference of 0.42%).
| Demographics | Rating | Rank | Median Female Earnings |
| Russians | 100.0 /100 | #34 | Exceptional $44,169 |
| Immigrants | Sri Lanka | 100.0 /100 | #35 | Exceptional $44,161 |
| Immigrants | Turkey | 100.0 /100 | #36 | Exceptional $44,066 |
| Immigrants | Switzerland | 100.0 /100 | #37 | Exceptional $43,996 |
| Latvians | 100.0 /100 | #38 | Exceptional $43,941 |
| Israelis | 100.0 /100 | #39 | Exceptional $43,852 |
| Immigrants | Malaysia | 100.0 /100 | #40 | Exceptional $43,835 |
| Bhutanese | 100.0 /100 | #41 | Exceptional $43,648 |
| Immigrants | Denmark | 100.0 /100 | #42 | Exceptional $43,646 |
| Bulgarians | 100.0 /100 | #43 | Exceptional $43,638 |
| Immigrants | Czechoslovakia | 100.0 /100 | #44 | Exceptional $43,571 |
| Immigrants | Europe | 100.0 /100 | #45 | Exceptional $43,523 |
| Immigrants | Bolivia | 100.0 /100 | #46 | Exceptional $43,467 |
| Bolivians | 100.0 /100 | #47 | Exceptional $43,445 |
| Immigrants | Indonesia | 100.0 /100 | #48 | Exceptional $43,412 |
Demographics Similar to Thais by Median Female Earnings
In terms of median female earnings, the demographic groups most similar to Thais are Immigrants from Ireland ($47,598, a difference of 0.040%), Iranian ($47,421, a difference of 0.33%), Immigrants from Singapore ($47,986, a difference of 0.86%), Immigrants from Iran ($47,154, a difference of 0.90%), and Immigrants from China ($46,972, a difference of 1.3%).
| Demographics | Rating | Rank | Median Female Earnings |
| Immigrants | Hong Kong | 100.0 /100 | #1 | Exceptional $49,818 |
| Filipinos | 100.0 /100 | #2 | Exceptional $49,508 |
| Immigrants | Taiwan | 100.0 /100 | #3 | Exceptional $49,256 |
| Immigrants | India | 100.0 /100 | #4 | Exceptional $48,292 |
| Immigrants | Singapore | 100.0 /100 | #5 | Exceptional $47,986 |
| Immigrants | Ireland | 100.0 /100 | #6 | Exceptional $47,598 |
| Thais | 100.0 /100 | #7 | Exceptional $47,577 |
| Iranians | 100.0 /100 | #8 | Exceptional $47,421 |
| Immigrants | Iran | 100.0 /100 | #9 | Exceptional $47,154 |
| Immigrants | China | 100.0 /100 | #10 | Exceptional $46,972 |
| Okinawans | 100.0 /100 | #11 | Exceptional $46,905 |
| Immigrants | Israel | 100.0 /100 | #12 | Exceptional $46,902 |
| Immigrants | Australia | 100.0 /100 | #13 | Exceptional $46,573 |
| Soviet Union | 100.0 /100 | #14 | Exceptional $46,556 |
| Immigrants | Eastern Asia | 100.0 /100 | #15 | Exceptional $46,502 |