Burmese vs Immigrants from Northern Europe Median Male Earnings
COMPARE
Burmese
Immigrants from Northern Europe
Median Male Earnings
Median Male Earnings Comparison
Burmese
Immigrants from Northern Europe
$65,236
MEDIAN MALE EARNINGS
100.0/ 100
METRIC RATING
22nd/ 347
METRIC RANK
$64,987
MEDIAN MALE EARNINGS
100.0/ 100
METRIC RATING
24th/ 347
METRIC RANK
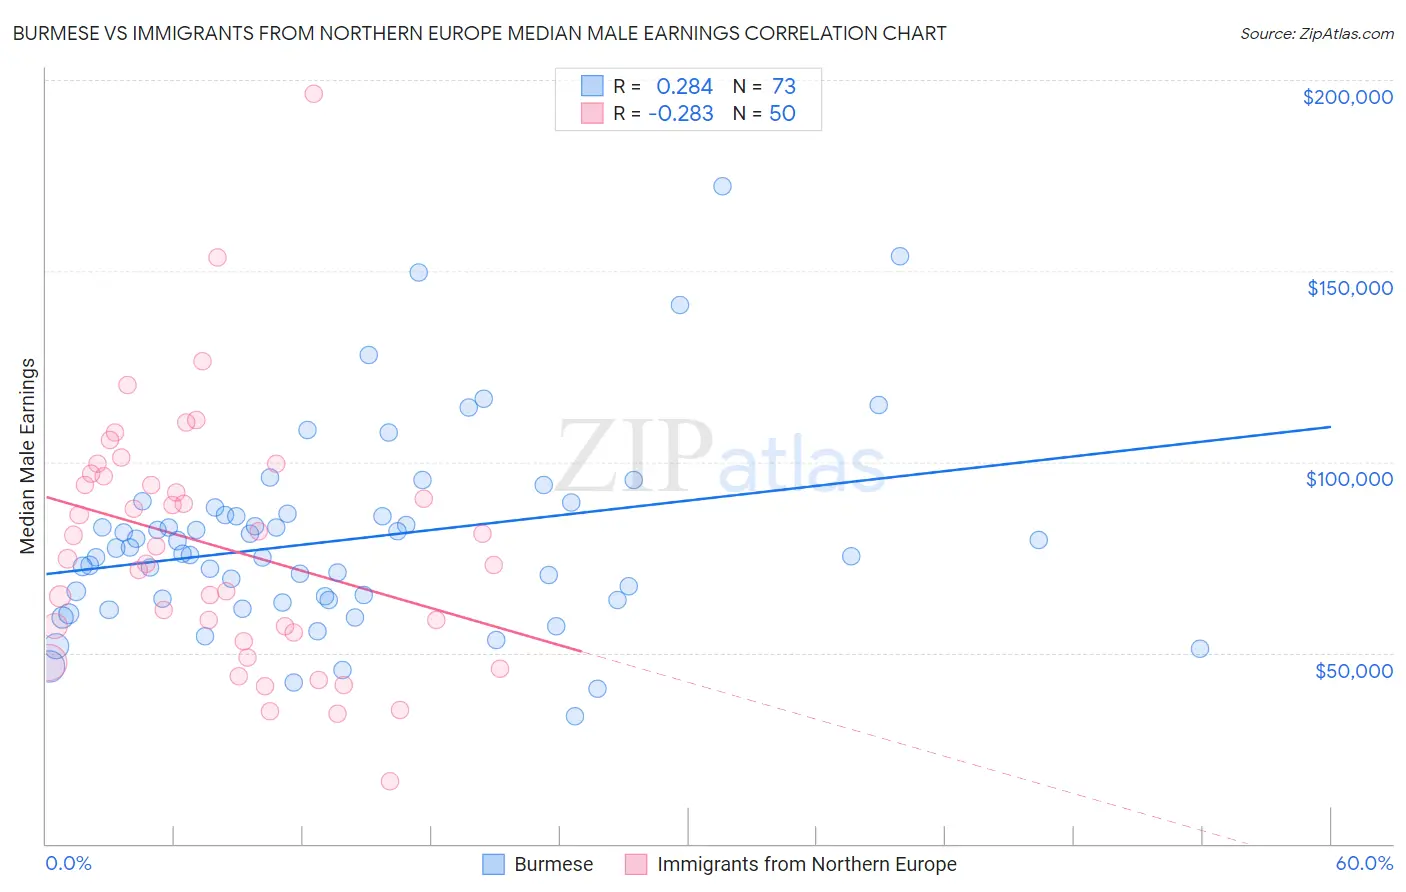
Burmese vs Immigrants from Northern Europe Median Male Earnings Correlation Chart
The statistical analysis conducted on geographies consisting of 465,224,564 people shows a weak positive correlation between the proportion of Burmese and median male earnings in the United States with a correlation coefficient (R) of 0.284 and weighted average of $65,236. Similarly, the statistical analysis conducted on geographies consisting of 476,848,141 people shows a weak negative correlation between the proportion of Immigrants from Northern Europe and median male earnings in the United States with a correlation coefficient (R) of -0.283 and weighted average of $64,987, a difference of 0.38%.
Median Male Earnings Correlation Summary
| Measurement | Burmese | Immigrants from Northern Europe |
| Minimum | $33,399 | $16,326 |
| Maximum | $172,143 | $196,250 |
| Range | $138,744 | $179,924 |
| Mean | $79,644 | $77,779 |
| Median | $75,943 | $76,341 |
| Interquartile 25% (IQ1) | $63,717 | $55,250 |
| Interquartile 75% (IQ3) | $86,383 | $96,105 |
| Interquartile Range (IQR) | $22,666 | $40,855 |
| Standard Deviation (Sample) | $25,713 | $32,560 |
| Standard Deviation (Population) | $25,536 | $32,233 |
Demographics Similar to Burmese and Immigrants from Northern Europe by Median Male Earnings
In terms of median male earnings, the demographic groups most similar to Burmese are Immigrants from Korea ($65,079, a difference of 0.24%), Immigrants from Sweden ($65,406, a difference of 0.26%), Immigrants from Japan ($65,518, a difference of 0.43%), Cypriot ($65,549, a difference of 0.48%), and Immigrants from Denmark ($64,625, a difference of 0.95%). Similarly, the demographic groups most similar to Immigrants from Northern Europe are Immigrants from Korea ($65,079, a difference of 0.14%), Immigrants from Denmark ($64,625, a difference of 0.56%), Immigrants from Sweden ($65,406, a difference of 0.65%), Immigrants from Japan ($65,518, a difference of 0.82%), and Cypriot ($65,549, a difference of 0.86%).
| Demographics | Rating | Rank | Median Male Earnings |
| Immigrants | China | 100.0 /100 | #13 | Exceptional $67,353 |
| Okinawans | 100.0 /100 | #14 | Exceptional $67,232 |
| Immigrants | Eastern Asia | 100.0 /100 | #15 | Exceptional $66,903 |
| Eastern Europeans | 100.0 /100 | #16 | Exceptional $66,472 |
| Immigrants | Belgium | 100.0 /100 | #17 | Exceptional $66,125 |
| Indians (Asian) | 100.0 /100 | #18 | Exceptional $66,078 |
| Cypriots | 100.0 /100 | #19 | Exceptional $65,549 |
| Immigrants | Japan | 100.0 /100 | #20 | Exceptional $65,518 |
| Immigrants | Sweden | 100.0 /100 | #21 | Exceptional $65,406 |
| Burmese | 100.0 /100 | #22 | Exceptional $65,236 |
| Immigrants | Korea | 100.0 /100 | #23 | Exceptional $65,079 |
| Immigrants | Northern Europe | 100.0 /100 | #24 | Exceptional $64,987 |
| Immigrants | Denmark | 100.0 /100 | #25 | Exceptional $64,625 |
| Turks | 100.0 /100 | #26 | Exceptional $64,253 |
| Immigrants | Switzerland | 100.0 /100 | #27 | Exceptional $63,944 |
| Russians | 100.0 /100 | #28 | Exceptional $63,939 |
| Asians | 100.0 /100 | #29 | Exceptional $63,827 |
| Immigrants | France | 100.0 /100 | #30 | Exceptional $63,715 |
| Latvians | 100.0 /100 | #31 | Exceptional $63,498 |
| Soviet Union | 100.0 /100 | #32 | Exceptional $63,382 |
| Immigrants | Lithuania | 100.0 /100 | #33 | Exceptional $63,346 |