Bulgarian vs Carpatho Rusyn Median Female Earnings
COMPARE
Bulgarian
Carpatho Rusyn
Median Female Earnings
Median Female Earnings Comparison
Bulgarians
Carpatho Rusyns
$43,638
MEDIAN FEMALE EARNINGS
100.0/ 100
METRIC RATING
43rd/ 347
METRIC RANK
$40,825
MEDIAN FEMALE EARNINGS
91.2/ 100
METRIC RATING
128th/ 347
METRIC RANK
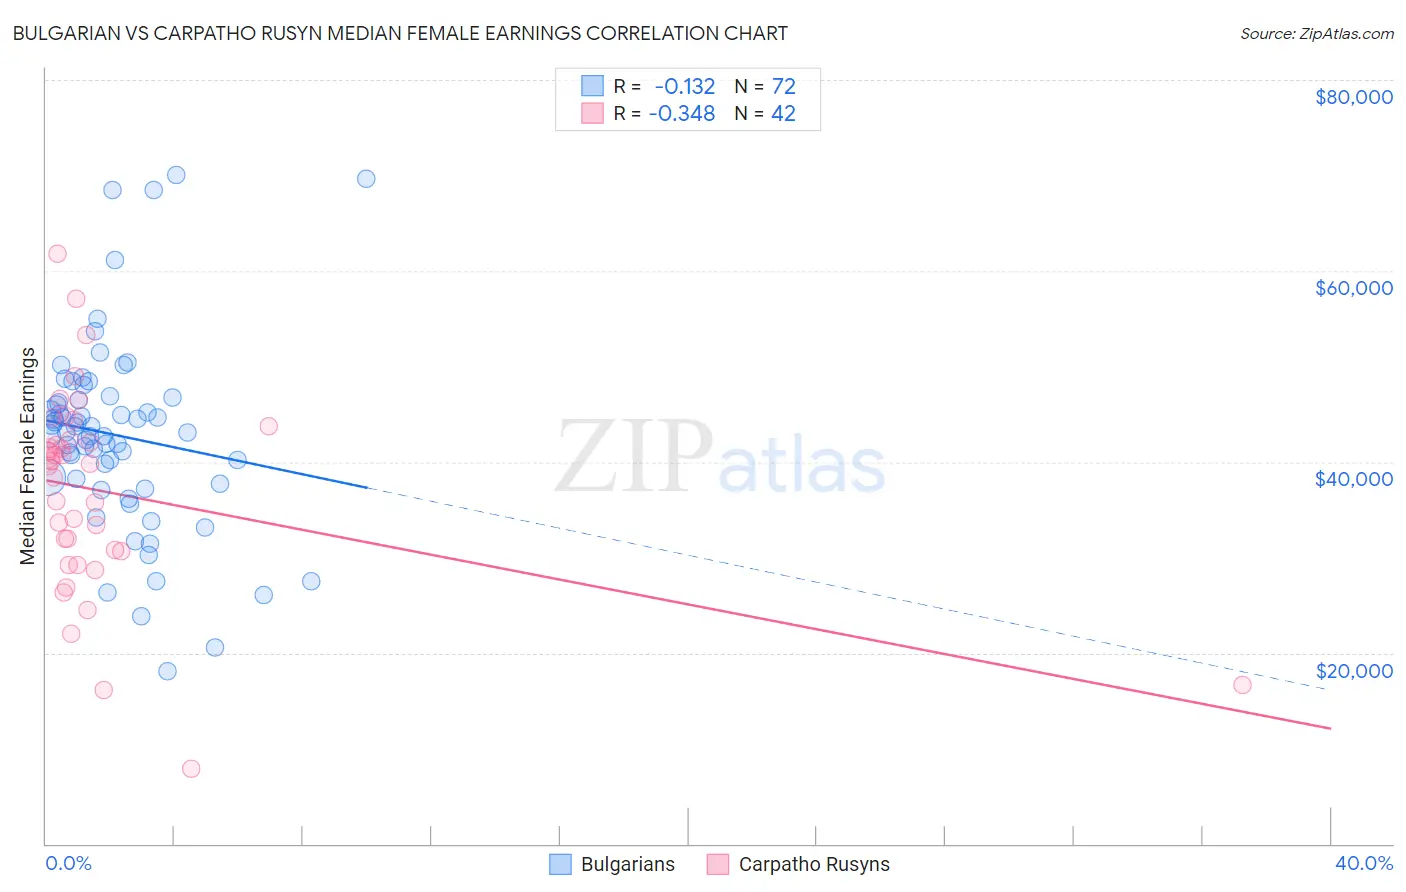
Bulgarian vs Carpatho Rusyn Median Female Earnings Correlation Chart
The statistical analysis conducted on geographies consisting of 205,601,132 people shows a poor negative correlation between the proportion of Bulgarians and median female earnings in the United States with a correlation coefficient (R) of -0.132 and weighted average of $43,638. Similarly, the statistical analysis conducted on geographies consisting of 58,866,706 people shows a mild negative correlation between the proportion of Carpatho Rusyns and median female earnings in the United States with a correlation coefficient (R) of -0.348 and weighted average of $40,825, a difference of 6.9%.
Median Female Earnings Correlation Summary
| Measurement | Bulgarian | Carpatho Rusyn |
| Minimum | $18,066 | $7,813 |
| Maximum | $70,060 | $61,814 |
| Range | $51,994 | $54,001 |
| Mean | $42,770 | $36,836 |
| Median | $43,122 | $39,667 |
| Interquartile 25% (IQ1) | $37,998 | $30,625 |
| Interquartile 75% (IQ3) | $46,606 | $42,321 |
| Interquartile Range (IQR) | $8,608 | $11,696 |
| Standard Deviation (Sample) | $10,148 | $10,700 |
| Standard Deviation (Population) | $10,078 | $10,572 |
Similar Demographics by Median Female Earnings
Demographics Similar to Bulgarians by Median Female Earnings
In terms of median female earnings, the demographic groups most similar to Bulgarians are Bhutanese ($43,648, a difference of 0.020%), Immigrants from Denmark ($43,646, a difference of 0.020%), Immigrants from Czechoslovakia ($43,571, a difference of 0.15%), Immigrants from Europe ($43,523, a difference of 0.26%), and Immigrants from Bolivia ($43,467, a difference of 0.39%).
| Demographics | Rating | Rank | Median Female Earnings |
| Immigrants | Turkey | 100.0 /100 | #36 | Exceptional $44,066 |
| Immigrants | Switzerland | 100.0 /100 | #37 | Exceptional $43,996 |
| Latvians | 100.0 /100 | #38 | Exceptional $43,941 |
| Israelis | 100.0 /100 | #39 | Exceptional $43,852 |
| Immigrants | Malaysia | 100.0 /100 | #40 | Exceptional $43,835 |
| Bhutanese | 100.0 /100 | #41 | Exceptional $43,648 |
| Immigrants | Denmark | 100.0 /100 | #42 | Exceptional $43,646 |
| Bulgarians | 100.0 /100 | #43 | Exceptional $43,638 |
| Immigrants | Czechoslovakia | 100.0 /100 | #44 | Exceptional $43,571 |
| Immigrants | Europe | 100.0 /100 | #45 | Exceptional $43,523 |
| Immigrants | Bolivia | 100.0 /100 | #46 | Exceptional $43,467 |
| Bolivians | 100.0 /100 | #47 | Exceptional $43,445 |
| Immigrants | Indonesia | 100.0 /100 | #48 | Exceptional $43,412 |
| Immigrants | Serbia | 100.0 /100 | #49 | Exceptional $43,385 |
| Immigrants | Uzbekistan | 100.0 /100 | #50 | Exceptional $43,363 |
Demographics Similar to Carpatho Rusyns by Median Female Earnings
In terms of median female earnings, the demographic groups most similar to Carpatho Rusyns are Zimbabwean ($40,798, a difference of 0.070%), Immigrants from Guyana ($40,773, a difference of 0.13%), Ugandan ($40,889, a difference of 0.16%), Immigrants from Trinidad and Tobago ($40,895, a difference of 0.17%), and Chilean ($40,757, a difference of 0.17%).
| Demographics | Rating | Rank | Median Female Earnings |
| Croatians | 93.7 /100 | #121 | Exceptional $40,993 |
| Immigrants | Jordan | 93.5 /100 | #122 | Exceptional $40,977 |
| Guyanese | 93.4 /100 | #123 | Exceptional $40,973 |
| Trinidadians and Tobagonians | 93.2 /100 | #124 | Exceptional $40,958 |
| Austrians | 92.7 /100 | #125 | Exceptional $40,923 |
| Immigrants | Trinidad and Tobago | 92.3 /100 | #126 | Exceptional $40,895 |
| Ugandans | 92.2 /100 | #127 | Exceptional $40,889 |
| Carpatho Rusyns | 91.2 /100 | #128 | Exceptional $40,825 |
| Zimbabweans | 90.8 /100 | #129 | Exceptional $40,798 |
| Immigrants | Guyana | 90.3 /100 | #130 | Exceptional $40,773 |
| Chileans | 90.0 /100 | #131 | Exceptional $40,757 |
| Immigrants | Uganda | 89.7 /100 | #132 | Excellent $40,739 |
| Syrians | 89.5 /100 | #133 | Excellent $40,727 |
| Arabs | 89.3 /100 | #134 | Excellent $40,718 |
| Immigrants | Nepal | 89.0 /100 | #135 | Excellent $40,704 |