Bulgarian vs Blackfeet Median Female Earnings
COMPARE
Bulgarian
Blackfeet
Median Female Earnings
Median Female Earnings Comparison
Bulgarians
Blackfeet
$43,638
MEDIAN FEMALE EARNINGS
100.0/ 100
METRIC RATING
43rd/ 347
METRIC RANK
$35,864
MEDIAN FEMALE EARNINGS
0.0/ 100
METRIC RATING
291st/ 347
METRIC RANK
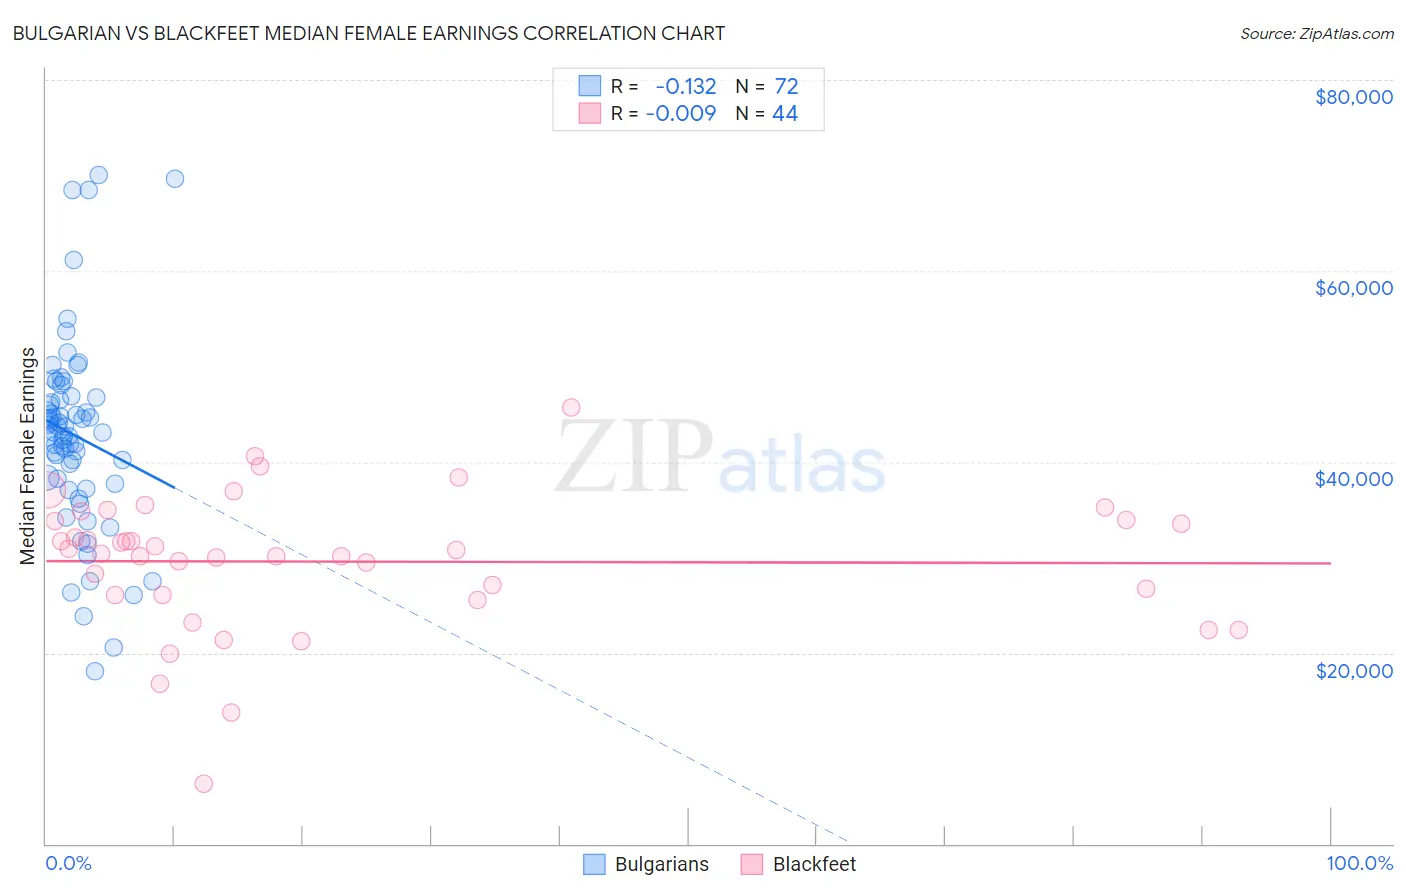
Bulgarian vs Blackfeet Median Female Earnings Correlation Chart
The statistical analysis conducted on geographies consisting of 205,601,132 people shows a poor negative correlation between the proportion of Bulgarians and median female earnings in the United States with a correlation coefficient (R) of -0.132 and weighted average of $43,638. Similarly, the statistical analysis conducted on geographies consisting of 309,402,871 people shows no correlation between the proportion of Blackfeet and median female earnings in the United States with a correlation coefficient (R) of -0.009 and weighted average of $35,864, a difference of 21.7%.
Median Female Earnings Correlation Summary
| Measurement | Bulgarian | Blackfeet |
| Minimum | $18,066 | $6,250 |
| Maximum | $70,060 | $45,714 |
| Range | $51,994 | $39,464 |
| Mean | $42,770 | $29,547 |
| Median | $43,122 | $30,603 |
| Interquartile 25% (IQ1) | $37,998 | $26,095 |
| Interquartile 75% (IQ3) | $46,606 | $33,875 |
| Interquartile Range (IQR) | $8,608 | $7,780 |
| Standard Deviation (Sample) | $10,148 | $7,260 |
| Standard Deviation (Population) | $10,078 | $7,177 |
Similar Demographics by Median Female Earnings
Demographics Similar to Bulgarians by Median Female Earnings
In terms of median female earnings, the demographic groups most similar to Bulgarians are Bhutanese ($43,648, a difference of 0.020%), Immigrants from Denmark ($43,646, a difference of 0.020%), Immigrants from Czechoslovakia ($43,571, a difference of 0.15%), Immigrants from Europe ($43,523, a difference of 0.26%), and Immigrants from Bolivia ($43,467, a difference of 0.39%).
| Demographics | Rating | Rank | Median Female Earnings |
| Immigrants | Turkey | 100.0 /100 | #36 | Exceptional $44,066 |
| Immigrants | Switzerland | 100.0 /100 | #37 | Exceptional $43,996 |
| Latvians | 100.0 /100 | #38 | Exceptional $43,941 |
| Israelis | 100.0 /100 | #39 | Exceptional $43,852 |
| Immigrants | Malaysia | 100.0 /100 | #40 | Exceptional $43,835 |
| Bhutanese | 100.0 /100 | #41 | Exceptional $43,648 |
| Immigrants | Denmark | 100.0 /100 | #42 | Exceptional $43,646 |
| Bulgarians | 100.0 /100 | #43 | Exceptional $43,638 |
| Immigrants | Czechoslovakia | 100.0 /100 | #44 | Exceptional $43,571 |
| Immigrants | Europe | 100.0 /100 | #45 | Exceptional $43,523 |
| Immigrants | Bolivia | 100.0 /100 | #46 | Exceptional $43,467 |
| Bolivians | 100.0 /100 | #47 | Exceptional $43,445 |
| Immigrants | Indonesia | 100.0 /100 | #48 | Exceptional $43,412 |
| Immigrants | Serbia | 100.0 /100 | #49 | Exceptional $43,385 |
| Immigrants | Uzbekistan | 100.0 /100 | #50 | Exceptional $43,363 |
Demographics Similar to Blackfeet by Median Female Earnings
In terms of median female earnings, the demographic groups most similar to Blackfeet are Central American Indian ($35,930, a difference of 0.18%), American ($35,777, a difference of 0.24%), Bangladeshi ($35,960, a difference of 0.27%), Immigrants from Zaire ($36,017, a difference of 0.43%), and Immigrants from Nicaragua ($36,023, a difference of 0.44%).
| Demographics | Rating | Rank | Median Female Earnings |
| Indonesians | 0.1 /100 | #284 | Tragic $36,140 |
| Paiute | 0.1 /100 | #285 | Tragic $36,056 |
| Osage | 0.0 /100 | #286 | Tragic $36,034 |
| Immigrants | Nicaragua | 0.0 /100 | #287 | Tragic $36,023 |
| Immigrants | Zaire | 0.0 /100 | #288 | Tragic $36,017 |
| Bangladeshis | 0.0 /100 | #289 | Tragic $35,960 |
| Central American Indians | 0.0 /100 | #290 | Tragic $35,930 |
| Blackfeet | 0.0 /100 | #291 | Tragic $35,864 |
| Americans | 0.0 /100 | #292 | Tragic $35,777 |
| Guatemalans | 0.0 /100 | #293 | Tragic $35,695 |
| Cheyenne | 0.0 /100 | #294 | Tragic $35,673 |
| Comanche | 0.0 /100 | #295 | Tragic $35,661 |
| Mexican American Indians | 0.0 /100 | #296 | Tragic $35,629 |
| Hmong | 0.0 /100 | #297 | Tragic $35,498 |
| Immigrants | Micronesia | 0.0 /100 | #298 | Tragic $35,477 |