Bulgarian vs Immigrants from Romania Median Female Earnings
COMPARE
Bulgarian
Immigrants from Romania
Median Female Earnings
Median Female Earnings Comparison
Bulgarians
Immigrants from Romania
$43,638
MEDIAN FEMALE EARNINGS
100.0/ 100
METRIC RATING
43rd/ 347
METRIC RANK
$42,718
MEDIAN FEMALE EARNINGS
99.8/ 100
METRIC RATING
71st/ 347
METRIC RANK
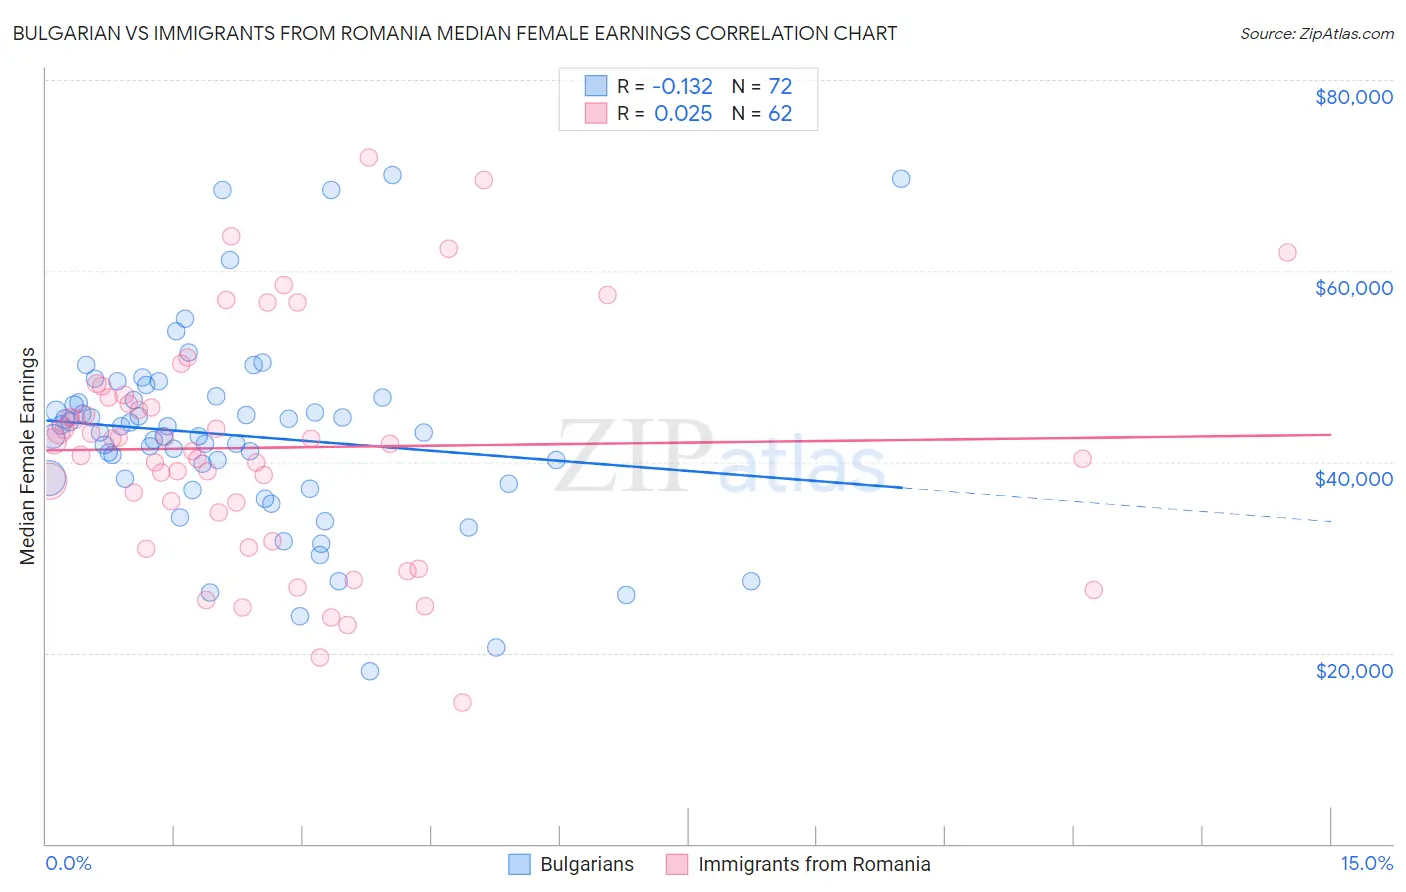
Bulgarian vs Immigrants from Romania Median Female Earnings Correlation Chart
The statistical analysis conducted on geographies consisting of 205,601,132 people shows a poor negative correlation between the proportion of Bulgarians and median female earnings in the United States with a correlation coefficient (R) of -0.132 and weighted average of $43,638. Similarly, the statistical analysis conducted on geographies consisting of 256,980,003 people shows no correlation between the proportion of Immigrants from Romania and median female earnings in the United States with a correlation coefficient (R) of 0.025 and weighted average of $42,718, a difference of 2.1%.
Median Female Earnings Correlation Summary
| Measurement | Bulgarian | Immigrants from Romania |
| Minimum | $18,066 | $14,853 |
| Maximum | $70,060 | $71,891 |
| Range | $51,994 | $57,038 |
| Mean | $42,770 | $41,494 |
| Median | $43,122 | $42,030 |
| Interquartile 25% (IQ1) | $37,998 | $34,661 |
| Interquartile 75% (IQ3) | $46,606 | $46,785 |
| Interquartile Range (IQR) | $8,608 | $12,125 |
| Standard Deviation (Sample) | $10,148 | $12,041 |
| Standard Deviation (Population) | $10,078 | $11,943 |
Similar Demographics by Median Female Earnings
Demographics Similar to Bulgarians by Median Female Earnings
In terms of median female earnings, the demographic groups most similar to Bulgarians are Bhutanese ($43,648, a difference of 0.020%), Immigrants from Denmark ($43,646, a difference of 0.020%), Immigrants from Czechoslovakia ($43,571, a difference of 0.15%), Immigrants from Europe ($43,523, a difference of 0.26%), and Immigrants from Bolivia ($43,467, a difference of 0.39%).
| Demographics | Rating | Rank | Median Female Earnings |
| Immigrants | Turkey | 100.0 /100 | #36 | Exceptional $44,066 |
| Immigrants | Switzerland | 100.0 /100 | #37 | Exceptional $43,996 |
| Latvians | 100.0 /100 | #38 | Exceptional $43,941 |
| Israelis | 100.0 /100 | #39 | Exceptional $43,852 |
| Immigrants | Malaysia | 100.0 /100 | #40 | Exceptional $43,835 |
| Bhutanese | 100.0 /100 | #41 | Exceptional $43,648 |
| Immigrants | Denmark | 100.0 /100 | #42 | Exceptional $43,646 |
| Bulgarians | 100.0 /100 | #43 | Exceptional $43,638 |
| Immigrants | Czechoslovakia | 100.0 /100 | #44 | Exceptional $43,571 |
| Immigrants | Europe | 100.0 /100 | #45 | Exceptional $43,523 |
| Immigrants | Bolivia | 100.0 /100 | #46 | Exceptional $43,467 |
| Bolivians | 100.0 /100 | #47 | Exceptional $43,445 |
| Immigrants | Indonesia | 100.0 /100 | #48 | Exceptional $43,412 |
| Immigrants | Serbia | 100.0 /100 | #49 | Exceptional $43,385 |
| Immigrants | Uzbekistan | 100.0 /100 | #50 | Exceptional $43,363 |
Demographics Similar to Immigrants from Romania by Median Female Earnings
In terms of median female earnings, the demographic groups most similar to Immigrants from Romania are Immigrants from Ethiopia ($42,744, a difference of 0.060%), Immigrants from Spain ($42,815, a difference of 0.23%), Immigrants from Austria ($42,824, a difference of 0.25%), Immigrants from Norway ($42,837, a difference of 0.28%), and Immigrants from Egypt ($42,837, a difference of 0.28%).
| Demographics | Rating | Rank | Median Female Earnings |
| Immigrants | Pakistan | 99.9 /100 | #64 | Exceptional $43,052 |
| Sierra Leoneans | 99.9 /100 | #65 | Exceptional $42,868 |
| Immigrants | Norway | 99.9 /100 | #66 | Exceptional $42,837 |
| Immigrants | Egypt | 99.9 /100 | #67 | Exceptional $42,837 |
| Immigrants | Austria | 99.8 /100 | #68 | Exceptional $42,824 |
| Immigrants | Spain | 99.8 /100 | #69 | Exceptional $42,815 |
| Immigrants | Ethiopia | 99.8 /100 | #70 | Exceptional $42,744 |
| Immigrants | Romania | 99.8 /100 | #71 | Exceptional $42,718 |
| Albanians | 99.8 /100 | #72 | Exceptional $42,584 |
| Mongolians | 99.7 /100 | #73 | Exceptional $42,542 |
| Immigrants | South Africa | 99.7 /100 | #74 | Exceptional $42,508 |
| New Zealanders | 99.7 /100 | #75 | Exceptional $42,446 |
| Immigrants | Italy | 99.7 /100 | #76 | Exceptional $42,446 |
| Immigrants | Albania | 99.6 /100 | #77 | Exceptional $42,388 |
| Immigrants | Kazakhstan | 99.6 /100 | #78 | Exceptional $42,386 |