Brazilian vs Immigrants from Afghanistan Householder Income Ages 25 - 44 years
COMPARE
Brazilian
Immigrants from Afghanistan
Householder Income Ages 25 - 44 years
Householder Income Ages 25 - 44 years Comparison
Brazilians
Immigrants from Afghanistan
$98,267
HOUSEHOLDER INCOME AGES 25 - 44 YEARS
88.6/ 100
METRIC RATING
129th/ 347
METRIC RANK
$99,977
HOUSEHOLDER INCOME AGES 25 - 44 YEARS
95.3/ 100
METRIC RATING
110th/ 347
METRIC RANK
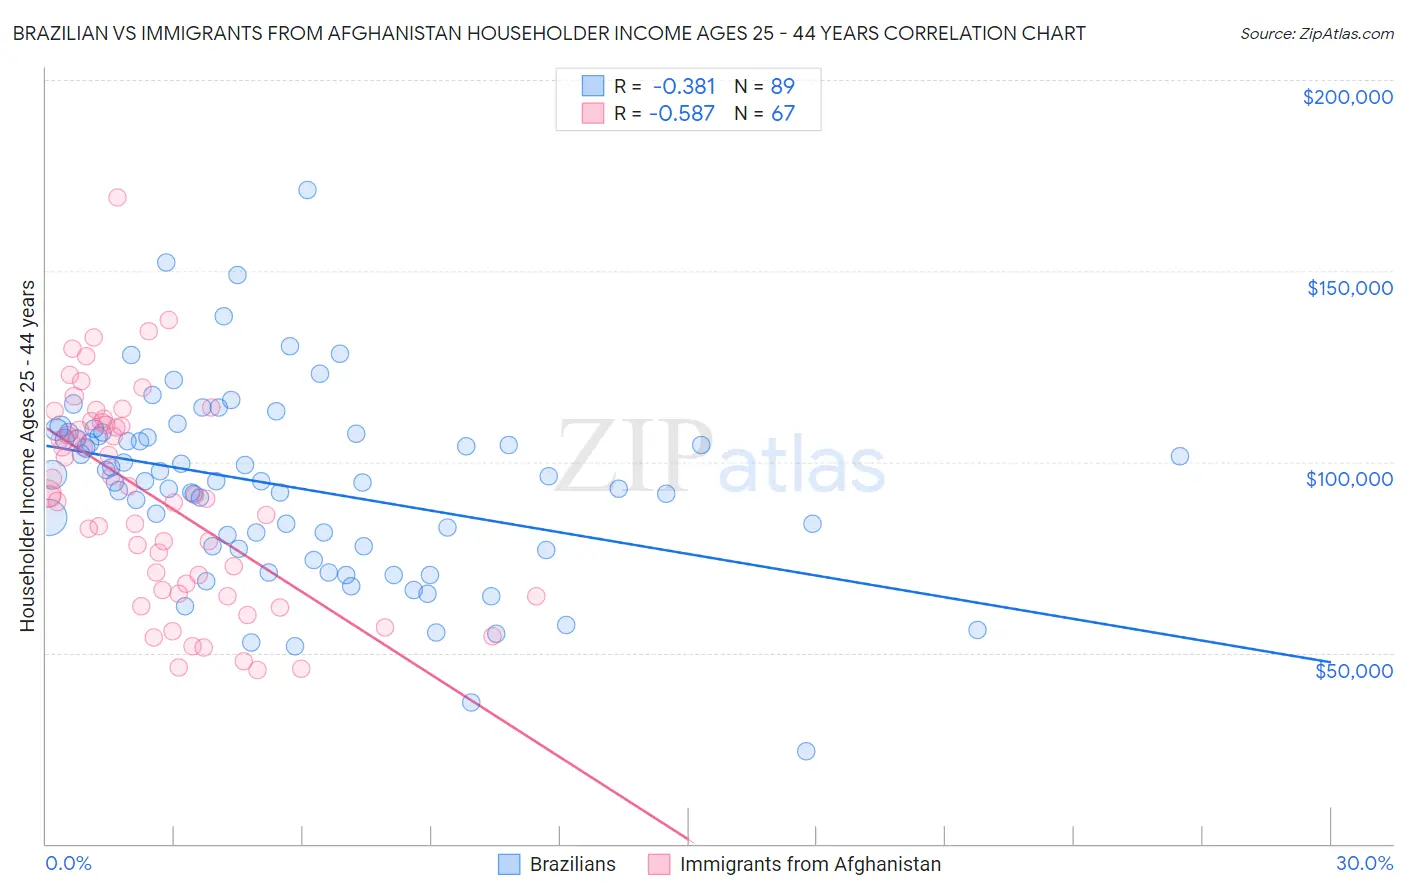
Brazilian vs Immigrants from Afghanistan Householder Income Ages 25 - 44 years Correlation Chart
The statistical analysis conducted on geographies consisting of 323,332,092 people shows a mild negative correlation between the proportion of Brazilians and household income with householder between the ages 25 and 44 in the United States with a correlation coefficient (R) of -0.381 and weighted average of $98,267. Similarly, the statistical analysis conducted on geographies consisting of 147,550,415 people shows a substantial negative correlation between the proportion of Immigrants from Afghanistan and household income with householder between the ages 25 and 44 in the United States with a correlation coefficient (R) of -0.587 and weighted average of $99,977, a difference of 1.7%.
Householder Income Ages 25 - 44 years Correlation Summary
| Measurement | Brazilian | Immigrants from Afghanistan |
| Minimum | $24,240 | $45,625 |
| Maximum | $171,042 | $169,252 |
| Range | $146,802 | $123,627 |
| Mean | $93,547 | $90,836 |
| Median | $94,950 | $91,322 |
| Interquartile 25% (IQ1) | $77,657 | $66,441 |
| Interquartile 75% (IQ3) | $107,059 | $110,235 |
| Interquartile Range (IQR) | $29,402 | $43,794 |
| Standard Deviation (Sample) | $24,480 | $27,071 |
| Standard Deviation (Population) | $24,342 | $26,868 |
Demographics Similar to Brazilians and Immigrants from Afghanistan by Householder Income Ages 25 - 44 years
In terms of householder income ages 25 - 44 years, the demographic groups most similar to Brazilians are European ($98,310, a difference of 0.040%), Serbian ($98,320, a difference of 0.050%), British ($98,359, a difference of 0.090%), Pakistani ($98,401, a difference of 0.14%), and Zimbabwean ($98,586, a difference of 0.32%). Similarly, the demographic groups most similar to Immigrants from Afghanistan are Chilean ($99,900, a difference of 0.080%), Immigrants from North Macedonia ($100,101, a difference of 0.12%), Polish ($99,685, a difference of 0.29%), Tongan ($99,604, a difference of 0.37%), and Immigrants from Western Asia ($99,516, a difference of 0.46%).
| Demographics | Rating | Rank | Householder Income Ages 25 - 44 years |
| Immigrants | North Macedonia | 95.6 /100 | #109 | Exceptional $100,101 |
| Immigrants | Afghanistan | 95.3 /100 | #110 | Exceptional $99,977 |
| Chileans | 95.1 /100 | #111 | Exceptional $99,900 |
| Poles | 94.5 /100 | #112 | Exceptional $99,685 |
| Tongans | 94.2 /100 | #113 | Exceptional $99,604 |
| Immigrants | Western Asia | 94.0 /100 | #114 | Exceptional $99,516 |
| Carpatho Rusyns | 93.7 /100 | #115 | Exceptional $99,449 |
| Portuguese | 93.7 /100 | #116 | Exceptional $99,429 |
| Immigrants | Northern Africa | 93.0 /100 | #117 | Exceptional $99,232 |
| Syrians | 92.9 /100 | #118 | Exceptional $99,215 |
| Jordanians | 92.8 /100 | #119 | Exceptional $99,186 |
| Swedes | 92.7 /100 | #120 | Exceptional $99,136 |
| Peruvians | 91.7 /100 | #121 | Exceptional $98,886 |
| Immigrants | Uzbekistan | 91.5 /100 | #122 | Exceptional $98,849 |
| Palestinians | 91.2 /100 | #123 | Exceptional $98,777 |
| Zimbabweans | 90.3 /100 | #124 | Exceptional $98,586 |
| Pakistanis | 89.3 /100 | #125 | Excellent $98,401 |
| British | 89.1 /100 | #126 | Excellent $98,359 |
| Serbians | 88.9 /100 | #127 | Excellent $98,320 |
| Europeans | 88.9 /100 | #128 | Excellent $98,310 |
| Brazilians | 88.6 /100 | #129 | Excellent $98,267 |