Brazilian vs Guatemalan Householder Income Ages 25 - 44 years
COMPARE
Brazilian
Guatemalan
Householder Income Ages 25 - 44 years
Householder Income Ages 25 - 44 years Comparison
Brazilians
Guatemalans
$98,267
HOUSEHOLDER INCOME AGES 25 - 44 YEARS
88.6/ 100
METRIC RATING
129th/ 347
METRIC RANK
$82,331
HOUSEHOLDER INCOME AGES 25 - 44 YEARS
0.1/ 100
METRIC RATING
283rd/ 347
METRIC RANK
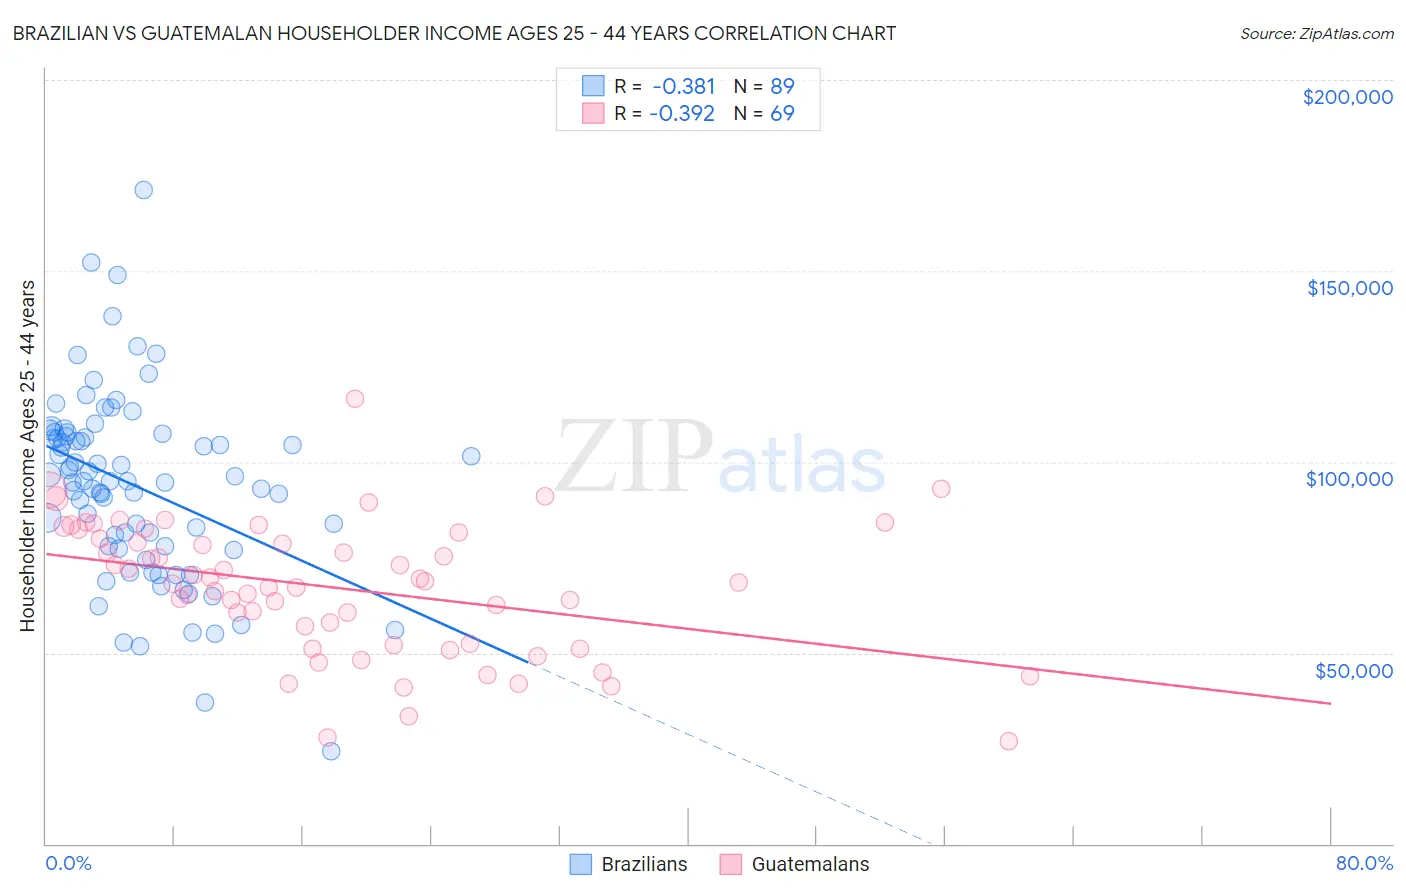
Brazilian vs Guatemalan Householder Income Ages 25 - 44 years Correlation Chart
The statistical analysis conducted on geographies consisting of 323,332,092 people shows a mild negative correlation between the proportion of Brazilians and household income with householder between the ages 25 and 44 in the United States with a correlation coefficient (R) of -0.381 and weighted average of $98,267. Similarly, the statistical analysis conducted on geographies consisting of 408,654,214 people shows a mild negative correlation between the proportion of Guatemalans and household income with householder between the ages 25 and 44 in the United States with a correlation coefficient (R) of -0.392 and weighted average of $82,331, a difference of 19.4%.
Householder Income Ages 25 - 44 years Correlation Summary
| Measurement | Brazilian | Guatemalan |
| Minimum | $24,240 | $26,896 |
| Maximum | $171,042 | $116,391 |
| Range | $146,802 | $89,495 |
| Mean | $93,547 | $66,998 |
| Median | $94,950 | $68,529 |
| Interquartile 25% (IQ1) | $77,657 | $52,170 |
| Interquartile 75% (IQ3) | $107,059 | $80,667 |
| Interquartile Range (IQR) | $29,402 | $28,496 |
| Standard Deviation (Sample) | $24,480 | $17,389 |
| Standard Deviation (Population) | $24,342 | $17,262 |
Similar Demographics by Householder Income Ages 25 - 44 years
Demographics Similar to Brazilians by Householder Income Ages 25 - 44 years
In terms of householder income ages 25 - 44 years, the demographic groups most similar to Brazilians are European ($98,310, a difference of 0.040%), Serbian ($98,320, a difference of 0.050%), British ($98,359, a difference of 0.090%), Pakistani ($98,401, a difference of 0.14%), and Immigrants from Kuwait ($98,122, a difference of 0.15%).
| Demographics | Rating | Rank | Householder Income Ages 25 - 44 years |
| Immigrants | Uzbekistan | 91.5 /100 | #122 | Exceptional $98,849 |
| Palestinians | 91.2 /100 | #123 | Exceptional $98,777 |
| Zimbabweans | 90.3 /100 | #124 | Exceptional $98,586 |
| Pakistanis | 89.3 /100 | #125 | Excellent $98,401 |
| British | 89.1 /100 | #126 | Excellent $98,359 |
| Serbians | 88.9 /100 | #127 | Excellent $98,320 |
| Europeans | 88.9 /100 | #128 | Excellent $98,310 |
| Brazilians | 88.6 /100 | #129 | Excellent $98,267 |
| Immigrants | Kuwait | 87.8 /100 | #130 | Excellent $98,122 |
| Immigrants | Albania | 86.6 /100 | #131 | Excellent $97,929 |
| Immigrants | Zimbabwe | 86.3 /100 | #132 | Excellent $97,880 |
| Tsimshian | 85.8 /100 | #133 | Excellent $97,809 |
| Canadians | 84.5 /100 | #134 | Excellent $97,625 |
| Immigrants | Oceania | 84.5 /100 | #135 | Excellent $97,623 |
| Hungarians | 83.9 /100 | #136 | Excellent $97,544 |
Demographics Similar to Guatemalans by Householder Income Ages 25 - 44 years
In terms of householder income ages 25 - 44 years, the demographic groups most similar to Guatemalans are Central American Indian ($82,355, a difference of 0.030%), Cajun ($82,393, a difference of 0.070%), Immigrants from Middle Africa ($82,254, a difference of 0.090%), Immigrants from Somalia ($82,188, a difference of 0.17%), and Ute ($82,166, a difference of 0.20%).
| Demographics | Rating | Rank | Householder Income Ages 25 - 44 years |
| Immigrants | Belize | 0.2 /100 | #276 | Tragic $83,141 |
| Paiute | 0.2 /100 | #277 | Tragic $82,984 |
| Senegalese | 0.2 /100 | #278 | Tragic $82,852 |
| Pima | 0.1 /100 | #279 | Tragic $82,821 |
| Colville | 0.1 /100 | #280 | Tragic $82,604 |
| Cajuns | 0.1 /100 | #281 | Tragic $82,393 |
| Central American Indians | 0.1 /100 | #282 | Tragic $82,355 |
| Guatemalans | 0.1 /100 | #283 | Tragic $82,331 |
| Immigrants | Middle Africa | 0.1 /100 | #284 | Tragic $82,254 |
| Immigrants | Somalia | 0.1 /100 | #285 | Tragic $82,188 |
| Ute | 0.1 /100 | #286 | Tragic $82,166 |
| Immigrants | Latin America | 0.1 /100 | #287 | Tragic $82,166 |
| Comanche | 0.1 /100 | #288 | Tragic $82,152 |
| Shoshone | 0.1 /100 | #289 | Tragic $82,062 |
| Liberians | 0.1 /100 | #290 | Tragic $82,005 |