Brazilian vs Immigrants from Syria Householder Income Ages 25 - 44 years
COMPARE
Brazilian
Immigrants from Syria
Householder Income Ages 25 - 44 years
Householder Income Ages 25 - 44 years Comparison
Brazilians
Immigrants from Syria
$98,267
HOUSEHOLDER INCOME AGES 25 - 44 YEARS
88.6/ 100
METRIC RATING
129th/ 347
METRIC RANK
$96,789
HOUSEHOLDER INCOME AGES 25 - 44 YEARS
77.4/ 100
METRIC RATING
147th/ 347
METRIC RANK
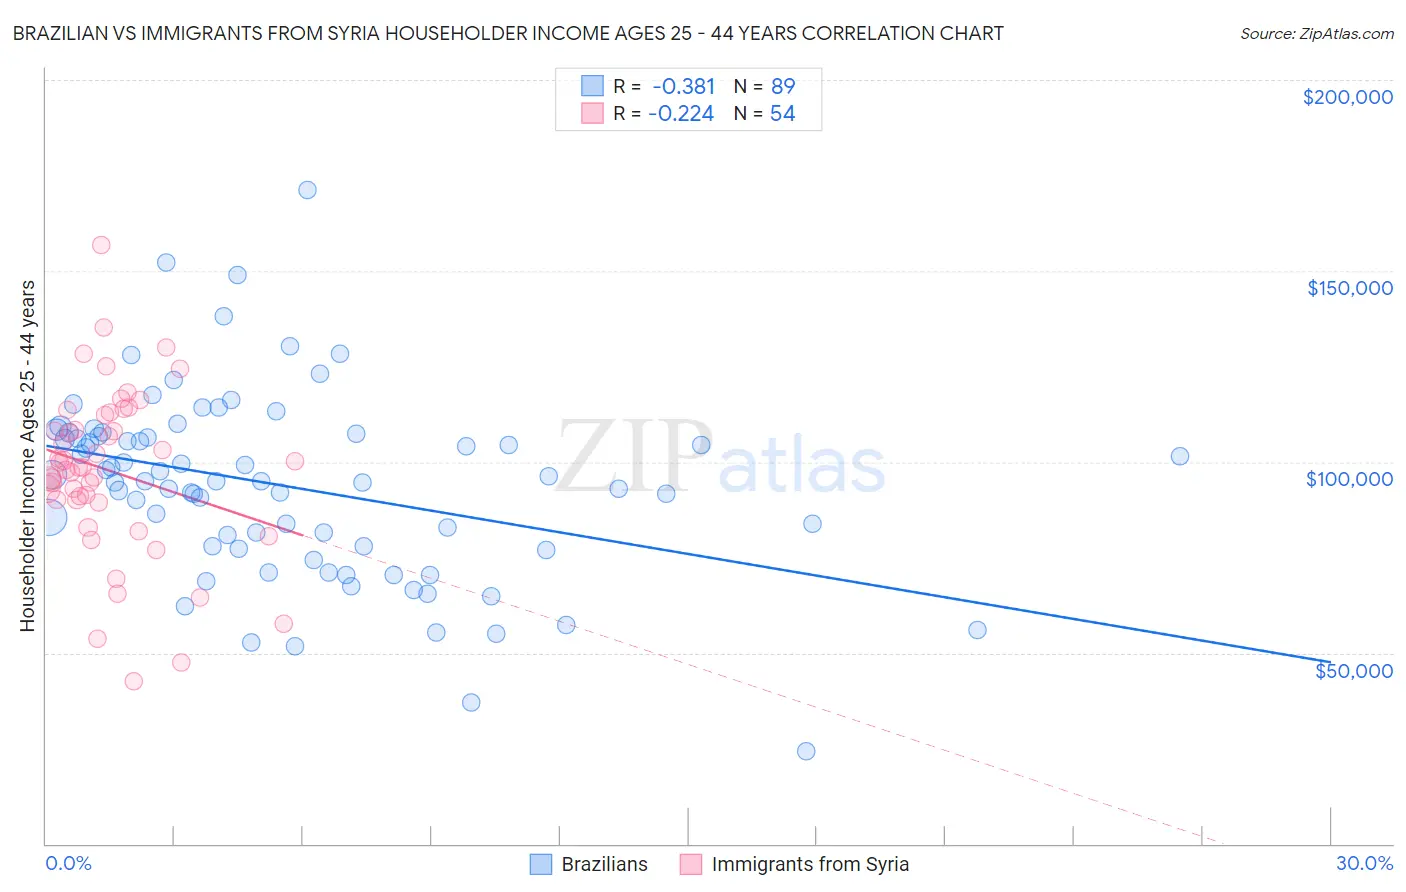
Brazilian vs Immigrants from Syria Householder Income Ages 25 - 44 years Correlation Chart
The statistical analysis conducted on geographies consisting of 323,332,092 people shows a mild negative correlation between the proportion of Brazilians and household income with householder between the ages 25 and 44 in the United States with a correlation coefficient (R) of -0.381 and weighted average of $98,267. Similarly, the statistical analysis conducted on geographies consisting of 174,044,447 people shows a weak negative correlation between the proportion of Immigrants from Syria and household income with householder between the ages 25 and 44 in the United States with a correlation coefficient (R) of -0.224 and weighted average of $96,789, a difference of 1.5%.
Householder Income Ages 25 - 44 years Correlation Summary
| Measurement | Brazilian | Immigrants from Syria |
| Minimum | $24,240 | $42,492 |
| Maximum | $171,042 | $156,643 |
| Range | $146,802 | $114,151 |
| Mean | $93,547 | $97,715 |
| Median | $94,950 | $98,566 |
| Interquartile 25% (IQ1) | $77,657 | $90,047 |
| Interquartile 75% (IQ3) | $107,059 | $112,269 |
| Interquartile Range (IQR) | $29,402 | $22,222 |
| Standard Deviation (Sample) | $24,480 | $21,833 |
| Standard Deviation (Population) | $24,342 | $21,629 |
Demographics Similar to Brazilians and Immigrants from Syria by Householder Income Ages 25 - 44 years
In terms of householder income ages 25 - 44 years, the demographic groups most similar to Brazilians are European ($98,310, a difference of 0.040%), Immigrants from Kuwait ($98,122, a difference of 0.15%), Immigrants from Albania ($97,929, a difference of 0.34%), Immigrants from Zimbabwe ($97,880, a difference of 0.40%), and Tsimshian ($97,809, a difference of 0.47%). Similarly, the demographic groups most similar to Immigrants from Syria are Ethiopian ($96,824, a difference of 0.040%), Irish ($96,730, a difference of 0.060%), Norwegian ($96,866, a difference of 0.080%), Immigrants from Chile ($97,159, a difference of 0.38%), and Immigrants from Jordan ($97,185, a difference of 0.41%).
| Demographics | Rating | Rank | Householder Income Ages 25 - 44 years |
| Europeans | 88.9 /100 | #128 | Excellent $98,310 |
| Brazilians | 88.6 /100 | #129 | Excellent $98,267 |
| Immigrants | Kuwait | 87.8 /100 | #130 | Excellent $98,122 |
| Immigrants | Albania | 86.6 /100 | #131 | Excellent $97,929 |
| Immigrants | Zimbabwe | 86.3 /100 | #132 | Excellent $97,880 |
| Tsimshian | 85.8 /100 | #133 | Excellent $97,809 |
| Canadians | 84.5 /100 | #134 | Excellent $97,625 |
| Immigrants | Oceania | 84.5 /100 | #135 | Excellent $97,623 |
| Hungarians | 83.9 /100 | #136 | Excellent $97,544 |
| Lebanese | 82.3 /100 | #137 | Excellent $97,339 |
| Arabs | 82.3 /100 | #138 | Excellent $97,336 |
| Immigrants | Peru | 82.2 /100 | #139 | Excellent $97,329 |
| Immigrants | Morocco | 82.0 /100 | #140 | Excellent $97,305 |
| Luxembourgers | 81.5 /100 | #141 | Excellent $97,237 |
| Danes | 81.3 /100 | #142 | Excellent $97,221 |
| Immigrants | Jordan | 81.0 /100 | #143 | Excellent $97,185 |
| Immigrants | Chile | 80.8 /100 | #144 | Excellent $97,159 |
| Norwegians | 78.2 /100 | #145 | Good $96,866 |
| Ethiopians | 77.8 /100 | #146 | Good $96,824 |
| Immigrants | Syria | 77.4 /100 | #147 | Good $96,789 |
| Irish | 76.9 /100 | #148 | Good $96,730 |