Immigrants from Bolivia vs Central American Householder Income Ages 25 - 44 years
COMPARE
Immigrants from Bolivia
Central American
Householder Income Ages 25 - 44 years
Householder Income Ages 25 - 44 years Comparison
Immigrants from Bolivia
Central Americans
$108,128
HOUSEHOLDER INCOME AGES 25 - 44 YEARS
99.9/ 100
METRIC RATING
41st/ 347
METRIC RANK
$85,144
HOUSEHOLDER INCOME AGES 25 - 44 YEARS
0.5/ 100
METRIC RATING
256th/ 347
METRIC RANK
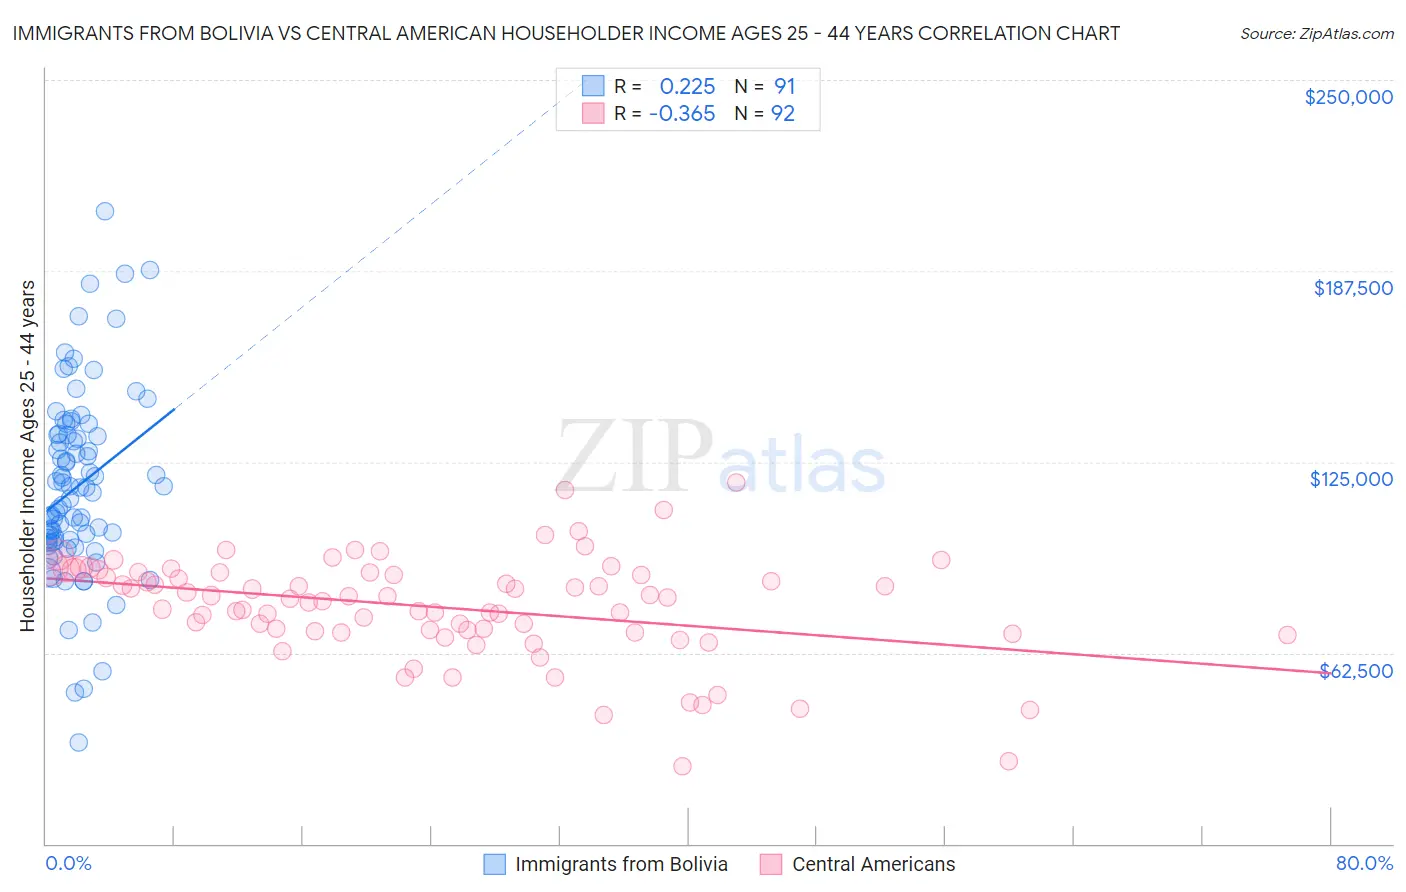
Immigrants from Bolivia vs Central American Householder Income Ages 25 - 44 years Correlation Chart
The statistical analysis conducted on geographies consisting of 158,645,666 people shows a weak positive correlation between the proportion of Immigrants from Bolivia and household income with householder between the ages 25 and 44 in the United States with a correlation coefficient (R) of 0.225 and weighted average of $108,128. Similarly, the statistical analysis conducted on geographies consisting of 502,385,785 people shows a mild negative correlation between the proportion of Central Americans and household income with householder between the ages 25 and 44 in the United States with a correlation coefficient (R) of -0.365 and weighted average of $85,144, a difference of 27.0%.
Householder Income Ages 25 - 44 years Correlation Summary
| Measurement | Immigrants from Bolivia | Central American |
| Minimum | $33,063 | $25,224 |
| Maximum | $207,065 | $118,125 |
| Range | $174,002 | $92,901 |
| Mean | $117,009 | $77,483 |
| Median | $116,442 | $80,487 |
| Interquartile 25% (IQ1) | $98,830 | $69,364 |
| Interquartile 75% (IQ3) | $133,840 | $88,864 |
| Interquartile Range (IQR) | $35,009 | $19,500 |
| Standard Deviation (Sample) | $30,560 | $16,910 |
| Standard Deviation (Population) | $30,391 | $16,818 |
Similar Demographics by Householder Income Ages 25 - 44 years
Demographics Similar to Immigrants from Bolivia by Householder Income Ages 25 - 44 years
In terms of householder income ages 25 - 44 years, the demographic groups most similar to Immigrants from Bolivia are Immigrants from Lithuania ($108,149, a difference of 0.020%), Immigrants from France ($108,257, a difference of 0.12%), Australian ($107,912, a difference of 0.20%), Soviet Union ($108,457, a difference of 0.30%), and Immigrants from Malaysia ($107,650, a difference of 0.44%).
| Demographics | Rating | Rank | Householder Income Ages 25 - 44 years |
| Bolivians | 100.0 /100 | #34 | Exceptional $109,372 |
| Immigrants | Switzerland | 100.0 /100 | #35 | Exceptional $109,185 |
| Latvians | 100.0 /100 | #36 | Exceptional $108,926 |
| Immigrants | Russia | 100.0 /100 | #37 | Exceptional $108,751 |
| Soviet Union | 100.0 /100 | #38 | Exceptional $108,457 |
| Immigrants | France | 99.9 /100 | #39 | Exceptional $108,257 |
| Immigrants | Lithuania | 99.9 /100 | #40 | Exceptional $108,149 |
| Immigrants | Bolivia | 99.9 /100 | #41 | Exceptional $108,128 |
| Australians | 99.9 /100 | #42 | Exceptional $107,912 |
| Immigrants | Malaysia | 99.9 /100 | #43 | Exceptional $107,650 |
| Immigrants | Indonesia | 99.9 /100 | #44 | Exceptional $107,627 |
| Israelis | 99.9 /100 | #45 | Exceptional $107,579 |
| Immigrants | Belarus | 99.9 /100 | #46 | Exceptional $107,393 |
| Estonians | 99.9 /100 | #47 | Exceptional $107,269 |
| Bulgarians | 99.9 /100 | #48 | Exceptional $107,264 |
Demographics Similar to Central Americans by Householder Income Ages 25 - 44 years
In terms of householder income ages 25 - 44 years, the demographic groups most similar to Central Americans are German Russian ($85,220, a difference of 0.090%), Mexican American Indian ($85,066, a difference of 0.090%), Immigrants from Nicaragua ($84,914, a difference of 0.27%), Immigrants from Senegal ($84,848, a difference of 0.35%), and American ($84,791, a difference of 0.42%).
| Demographics | Rating | Rank | Householder Income Ages 25 - 44 years |
| French American Indians | 0.8 /100 | #249 | Tragic $85,899 |
| Pennsylvania Germans | 0.8 /100 | #250 | Tragic $85,836 |
| Cape Verdeans | 0.8 /100 | #251 | Tragic $85,758 |
| Immigrants | Western Africa | 0.7 /100 | #252 | Tragic $85,676 |
| British West Indians | 0.7 /100 | #253 | Tragic $85,565 |
| Immigrants | Laos | 0.7 /100 | #254 | Tragic $85,553 |
| German Russians | 0.6 /100 | #255 | Tragic $85,220 |
| Central Americans | 0.5 /100 | #256 | Tragic $85,144 |
| Mexican American Indians | 0.5 /100 | #257 | Tragic $85,066 |
| Immigrants | Nicaragua | 0.5 /100 | #258 | Tragic $84,914 |
| Immigrants | Senegal | 0.5 /100 | #259 | Tragic $84,848 |
| Americans | 0.4 /100 | #260 | Tragic $84,791 |
| Inupiat | 0.4 /100 | #261 | Tragic $84,619 |
| Cree | 0.4 /100 | #262 | Tragic $84,574 |
| Belizeans | 0.4 /100 | #263 | Tragic $84,534 |