Bulgarian vs Central American Householder Income Ages 25 - 44 years
COMPARE
Bulgarian
Central American
Householder Income Ages 25 - 44 years
Householder Income Ages 25 - 44 years Comparison
Bulgarians
Central Americans
$107,264
HOUSEHOLDER INCOME AGES 25 - 44 YEARS
99.9/ 100
METRIC RATING
48th/ 347
METRIC RANK
$85,144
HOUSEHOLDER INCOME AGES 25 - 44 YEARS
0.5/ 100
METRIC RATING
256th/ 347
METRIC RANK
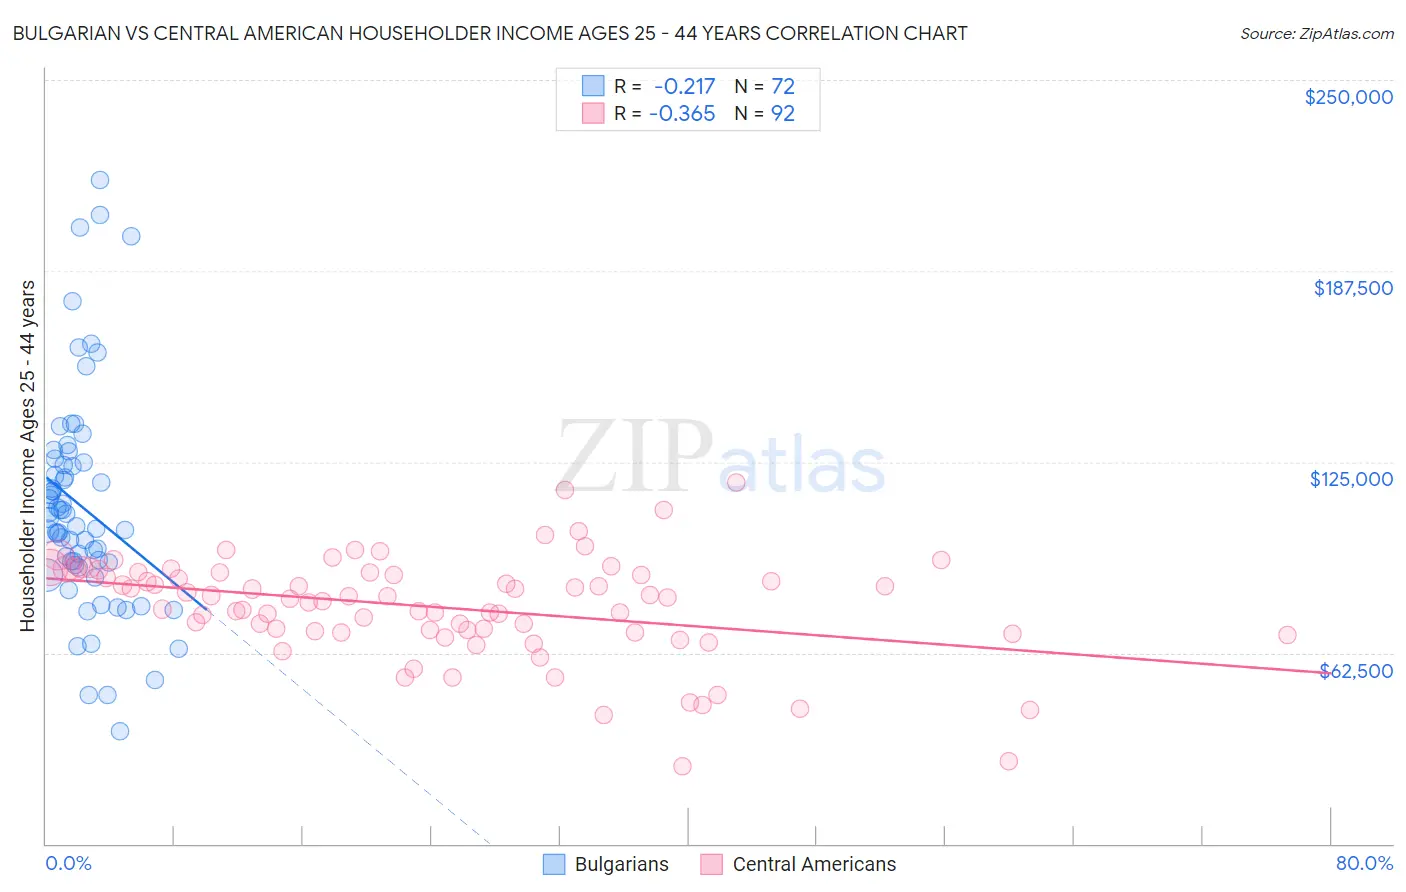
Bulgarian vs Central American Householder Income Ages 25 - 44 years Correlation Chart
The statistical analysis conducted on geographies consisting of 205,263,192 people shows a weak negative correlation between the proportion of Bulgarians and household income with householder between the ages 25 and 44 in the United States with a correlation coefficient (R) of -0.217 and weighted average of $107,264. Similarly, the statistical analysis conducted on geographies consisting of 502,385,785 people shows a mild negative correlation between the proportion of Central Americans and household income with householder between the ages 25 and 44 in the United States with a correlation coefficient (R) of -0.365 and weighted average of $85,144, a difference of 26.0%.
Householder Income Ages 25 - 44 years Correlation Summary
| Measurement | Bulgarian | Central American |
| Minimum | $36,944 | $25,224 |
| Maximum | $217,083 | $118,125 |
| Range | $180,139 | $92,901 |
| Mean | $110,338 | $77,483 |
| Median | $105,369 | $80,487 |
| Interquartile 25% (IQ1) | $91,534 | $69,364 |
| Interquartile 75% (IQ3) | $124,530 | $88,864 |
| Interquartile Range (IQR) | $32,997 | $19,500 |
| Standard Deviation (Sample) | $35,831 | $16,910 |
| Standard Deviation (Population) | $35,581 | $16,818 |
Similar Demographics by Householder Income Ages 25 - 44 years
Demographics Similar to Bulgarians by Householder Income Ages 25 - 44 years
In terms of householder income ages 25 - 44 years, the demographic groups most similar to Bulgarians are Estonian ($107,269, a difference of 0.010%), Immigrants from Turkey ($107,258, a difference of 0.010%), Cambodian ($107,148, a difference of 0.11%), Immigrants from Belarus ($107,393, a difference of 0.12%), and Israeli ($107,579, a difference of 0.29%).
| Demographics | Rating | Rank | Householder Income Ages 25 - 44 years |
| Immigrants | Bolivia | 99.9 /100 | #41 | Exceptional $108,128 |
| Australians | 99.9 /100 | #42 | Exceptional $107,912 |
| Immigrants | Malaysia | 99.9 /100 | #43 | Exceptional $107,650 |
| Immigrants | Indonesia | 99.9 /100 | #44 | Exceptional $107,627 |
| Israelis | 99.9 /100 | #45 | Exceptional $107,579 |
| Immigrants | Belarus | 99.9 /100 | #46 | Exceptional $107,393 |
| Estonians | 99.9 /100 | #47 | Exceptional $107,269 |
| Bulgarians | 99.9 /100 | #48 | Exceptional $107,264 |
| Immigrants | Turkey | 99.9 /100 | #49 | Exceptional $107,258 |
| Cambodians | 99.9 /100 | #50 | Exceptional $107,148 |
| Immigrants | Czechoslovakia | 99.9 /100 | #51 | Exceptional $106,888 |
| Immigrants | Europe | 99.9 /100 | #52 | Exceptional $106,817 |
| Immigrants | Norway | 99.9 /100 | #53 | Exceptional $106,629 |
| Paraguayans | 99.9 /100 | #54 | Exceptional $106,615 |
| Greeks | 99.9 /100 | #55 | Exceptional $106,457 |
Demographics Similar to Central Americans by Householder Income Ages 25 - 44 years
In terms of householder income ages 25 - 44 years, the demographic groups most similar to Central Americans are German Russian ($85,220, a difference of 0.090%), Mexican American Indian ($85,066, a difference of 0.090%), Immigrants from Nicaragua ($84,914, a difference of 0.27%), Immigrants from Senegal ($84,848, a difference of 0.35%), and American ($84,791, a difference of 0.42%).
| Demographics | Rating | Rank | Householder Income Ages 25 - 44 years |
| French American Indians | 0.8 /100 | #249 | Tragic $85,899 |
| Pennsylvania Germans | 0.8 /100 | #250 | Tragic $85,836 |
| Cape Verdeans | 0.8 /100 | #251 | Tragic $85,758 |
| Immigrants | Western Africa | 0.7 /100 | #252 | Tragic $85,676 |
| British West Indians | 0.7 /100 | #253 | Tragic $85,565 |
| Immigrants | Laos | 0.7 /100 | #254 | Tragic $85,553 |
| German Russians | 0.6 /100 | #255 | Tragic $85,220 |
| Central Americans | 0.5 /100 | #256 | Tragic $85,144 |
| Mexican American Indians | 0.5 /100 | #257 | Tragic $85,066 |
| Immigrants | Nicaragua | 0.5 /100 | #258 | Tragic $84,914 |
| Immigrants | Senegal | 0.5 /100 | #259 | Tragic $84,848 |
| Americans | 0.4 /100 | #260 | Tragic $84,791 |
| Inupiat | 0.4 /100 | #261 | Tragic $84,619 |
| Cree | 0.4 /100 | #262 | Tragic $84,574 |
| Belizeans | 0.4 /100 | #263 | Tragic $84,534 |