Yugoslavian vs Central American Householder Income Ages 25 - 44 years
COMPARE
Yugoslavian
Central American
Householder Income Ages 25 - 44 years
Householder Income Ages 25 - 44 years Comparison
Yugoslavians
Central Americans
$91,368
HOUSEHOLDER INCOME AGES 25 - 44 YEARS
14.5/ 100
METRIC RATING
207th/ 347
METRIC RANK
$85,144
HOUSEHOLDER INCOME AGES 25 - 44 YEARS
0.5/ 100
METRIC RATING
256th/ 347
METRIC RANK
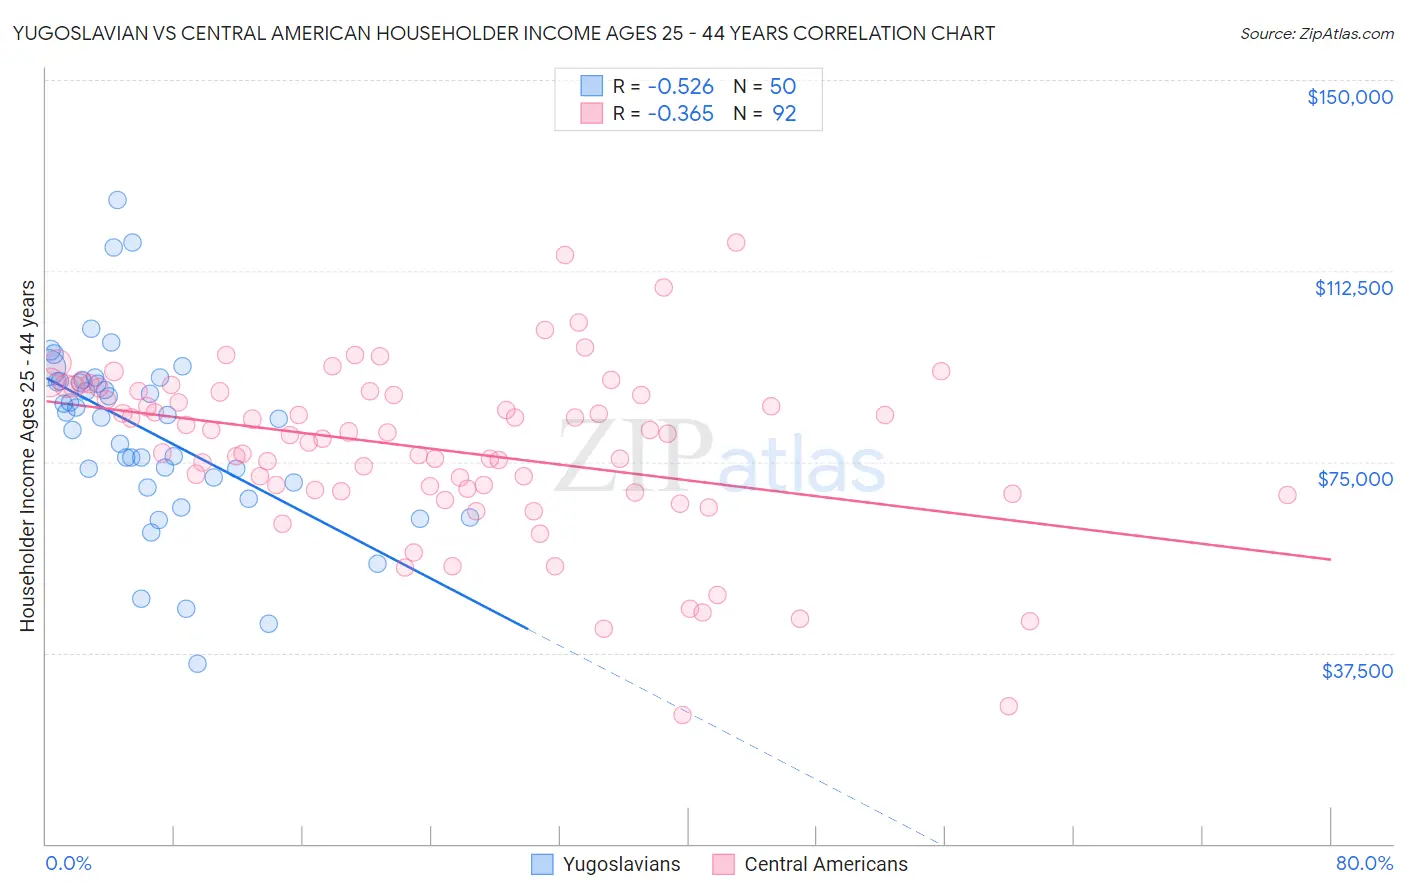
Yugoslavian vs Central American Householder Income Ages 25 - 44 years Correlation Chart
The statistical analysis conducted on geographies consisting of 285,145,495 people shows a substantial negative correlation between the proportion of Yugoslavians and household income with householder between the ages 25 and 44 in the United States with a correlation coefficient (R) of -0.526 and weighted average of $91,368. Similarly, the statistical analysis conducted on geographies consisting of 502,385,785 people shows a mild negative correlation between the proportion of Central Americans and household income with householder between the ages 25 and 44 in the United States with a correlation coefficient (R) of -0.365 and weighted average of $85,144, a difference of 7.3%.
Householder Income Ages 25 - 44 years Correlation Summary
| Measurement | Yugoslavian | Central American |
| Minimum | $35,313 | $25,224 |
| Maximum | $126,461 | $118,125 |
| Range | $91,148 | $92,901 |
| Mean | $80,797 | $77,483 |
| Median | $83,915 | $80,487 |
| Interquartile 25% (IQ1) | $71,042 | $69,364 |
| Interquartile 75% (IQ3) | $90,884 | $88,864 |
| Interquartile Range (IQR) | $19,842 | $19,500 |
| Standard Deviation (Sample) | $18,085 | $16,910 |
| Standard Deviation (Population) | $17,903 | $16,818 |
Similar Demographics by Householder Income Ages 25 - 44 years
Demographics Similar to Yugoslavians by Householder Income Ages 25 - 44 years
In terms of householder income ages 25 - 44 years, the demographic groups most similar to Yugoslavians are Aleut ($91,370, a difference of 0.0%), Immigrants from Thailand ($91,337, a difference of 0.030%), Immigrants from Eastern Africa ($91,458, a difference of 0.10%), Nepalese ($91,498, a difference of 0.14%), and Immigrants from Cambodia ($91,533, a difference of 0.18%).
| Demographics | Rating | Rank | Householder Income Ages 25 - 44 years |
| Whites/Caucasians | 16.7 /100 | #200 | Poor $91,668 |
| Japanese | 16.4 /100 | #201 | Poor $91,624 |
| Ecuadorians | 16.0 /100 | #202 | Poor $91,574 |
| Immigrants | Cambodia | 15.7 /100 | #203 | Poor $91,533 |
| Nepalese | 15.4 /100 | #204 | Poor $91,498 |
| Immigrants | Eastern Africa | 15.2 /100 | #205 | Poor $91,458 |
| Aleuts | 14.5 /100 | #206 | Poor $91,370 |
| Yugoslavians | 14.5 /100 | #207 | Poor $91,368 |
| Immigrants | Thailand | 14.3 /100 | #208 | Poor $91,337 |
| Immigrants | Uruguay | 13.2 /100 | #209 | Poor $91,171 |
| Immigrants | Kenya | 10.9 /100 | #210 | Poor $90,767 |
| Iraqis | 10.8 /100 | #211 | Poor $90,764 |
| Hawaiians | 10.6 /100 | #212 | Poor $90,722 |
| Immigrants | Bangladesh | 9.3 /100 | #213 | Tragic $90,448 |
| Immigrants | Africa | 8.9 /100 | #214 | Tragic $90,372 |
Demographics Similar to Central Americans by Householder Income Ages 25 - 44 years
In terms of householder income ages 25 - 44 years, the demographic groups most similar to Central Americans are German Russian ($85,220, a difference of 0.090%), Mexican American Indian ($85,066, a difference of 0.090%), Immigrants from Nicaragua ($84,914, a difference of 0.27%), Immigrants from Senegal ($84,848, a difference of 0.35%), and American ($84,791, a difference of 0.42%).
| Demographics | Rating | Rank | Householder Income Ages 25 - 44 years |
| French American Indians | 0.8 /100 | #249 | Tragic $85,899 |
| Pennsylvania Germans | 0.8 /100 | #250 | Tragic $85,836 |
| Cape Verdeans | 0.8 /100 | #251 | Tragic $85,758 |
| Immigrants | Western Africa | 0.7 /100 | #252 | Tragic $85,676 |
| British West Indians | 0.7 /100 | #253 | Tragic $85,565 |
| Immigrants | Laos | 0.7 /100 | #254 | Tragic $85,553 |
| German Russians | 0.6 /100 | #255 | Tragic $85,220 |
| Central Americans | 0.5 /100 | #256 | Tragic $85,144 |
| Mexican American Indians | 0.5 /100 | #257 | Tragic $85,066 |
| Immigrants | Nicaragua | 0.5 /100 | #258 | Tragic $84,914 |
| Immigrants | Senegal | 0.5 /100 | #259 | Tragic $84,848 |
| Americans | 0.4 /100 | #260 | Tragic $84,791 |
| Inupiat | 0.4 /100 | #261 | Tragic $84,619 |
| Cree | 0.4 /100 | #262 | Tragic $84,574 |
| Belizeans | 0.4 /100 | #263 | Tragic $84,534 |