Black/African American vs Russian In Labor Force | Age 25-29
COMPARE
Black/African American
Russian
In Labor Force | Age 25-29
In Labor Force | Age 25-29 Comparison
Blacks/African Americans
Russians
82.6%
IN LABOR FORCE | AGE 25-29
0.0/ 100
METRIC RATING
305th/ 347
METRIC RANK
85.3%
IN LABOR FORCE | AGE 25-29
98.8/ 100
METRIC RATING
73rd/ 347
METRIC RANK
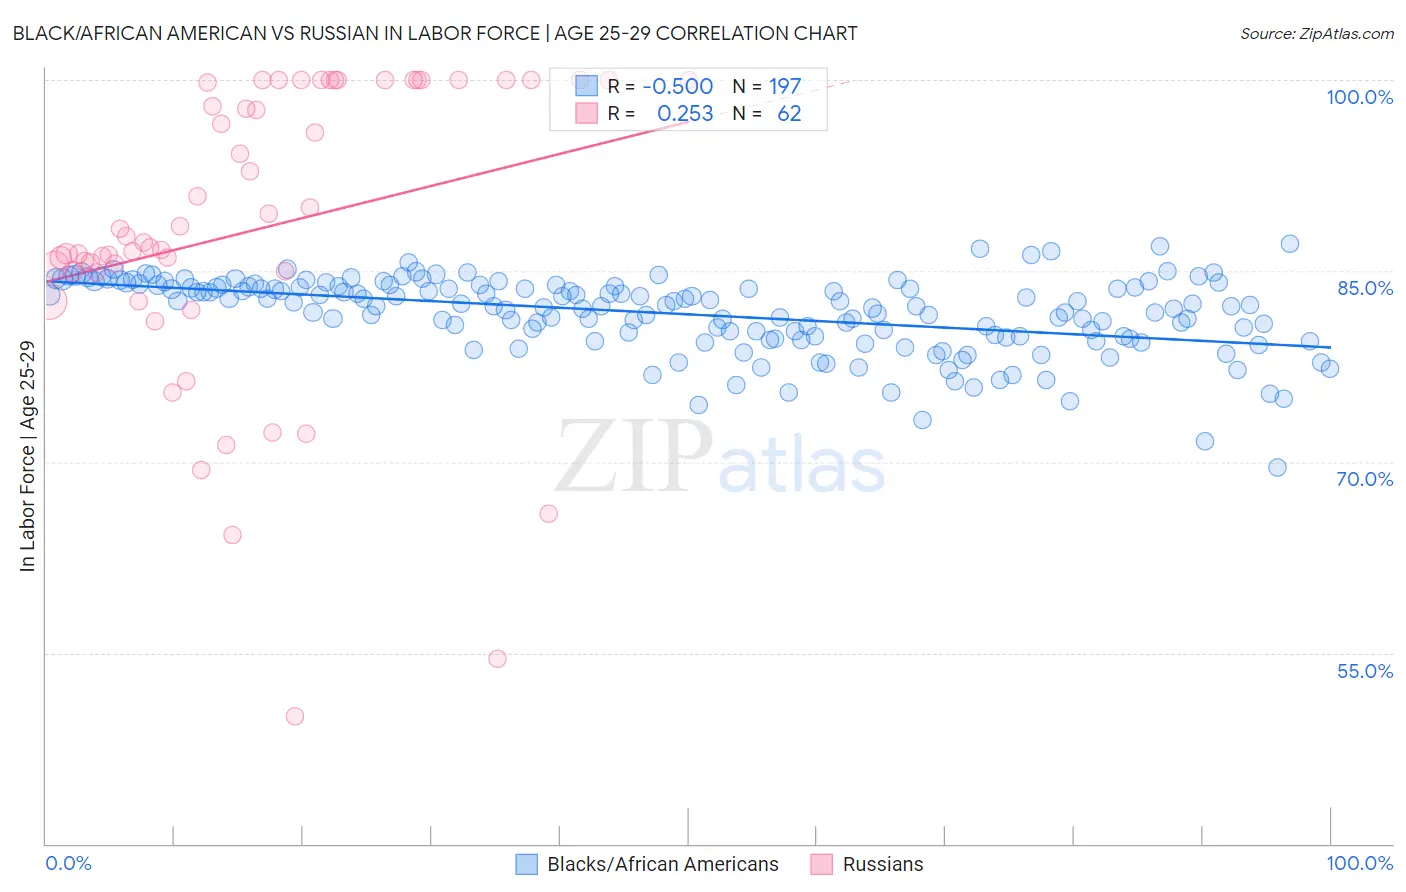
Black/African American vs Russian In Labor Force | Age 25-29 Correlation Chart
The statistical analysis conducted on geographies consisting of 565,000,978 people shows a moderate negative correlation between the proportion of Blacks/African Americans and labor force participation rate among population between the ages 25 and 29 in the United States with a correlation coefficient (R) of -0.500 and weighted average of 82.6%. Similarly, the statistical analysis conducted on geographies consisting of 511,687,113 people shows a weak positive correlation between the proportion of Russians and labor force participation rate among population between the ages 25 and 29 in the United States with a correlation coefficient (R) of 0.253 and weighted average of 85.3%, a difference of 3.3%.
In Labor Force | Age 25-29 Correlation Summary
| Measurement | Black/African American | Russian |
| Minimum | 69.5% | 50.0% |
| Maximum | 87.2% | 100.0% |
| Range | 17.6% | 50.0% |
| Mean | 81.6% | 88.2% |
| Median | 82.3% | 87.5% |
| Interquartile 25% (IQ1) | 79.8% | 85.0% |
| Interquartile 75% (IQ3) | 83.9% | 100.0% |
| Interquartile Range (IQR) | 4.0% | 15.0% |
| Standard Deviation (Sample) | 3.0% | 11.7% |
| Standard Deviation (Population) | 3.0% | 11.6% |
Similar Demographics by In Labor Force | Age 25-29
Demographics Similar to Blacks/African Americans by In Labor Force | Age 25-29
In terms of in labor force | age 25-29, the demographic groups most similar to Blacks/African Americans are Blackfeet (82.6%, a difference of 0.010%), Cajun (82.5%, a difference of 0.060%), Immigrants from St. Vincent and the Grenadines (82.7%, a difference of 0.12%), Central American Indian (82.4%, a difference of 0.21%), and Immigrants from Central America (82.4%, a difference of 0.22%).
| Demographics | Rating | Rank | In Labor Force | Age 25-29 |
| Native Hawaiians | 0.0 /100 | #298 | Tragic 82.9% |
| Fijians | 0.0 /100 | #299 | Tragic 82.9% |
| Spanish American Indians | 0.0 /100 | #300 | Tragic 82.9% |
| Vietnamese | 0.0 /100 | #301 | Tragic 82.8% |
| Immigrants | Belize | 0.0 /100 | #302 | Tragic 82.8% |
| Immigrants | Grenada | 0.0 /100 | #303 | Tragic 82.8% |
| Immigrants | St. Vincent and the Grenadines | 0.0 /100 | #304 | Tragic 82.7% |
| Blacks/African Americans | 0.0 /100 | #305 | Tragic 82.6% |
| Blackfeet | 0.0 /100 | #306 | Tragic 82.6% |
| Cajuns | 0.0 /100 | #307 | Tragic 82.5% |
| Central American Indians | 0.0 /100 | #308 | Tragic 82.4% |
| Immigrants | Central America | 0.0 /100 | #309 | Tragic 82.4% |
| Osage | 0.0 /100 | #310 | Tragic 82.3% |
| Alaskan Athabascans | 0.0 /100 | #311 | Tragic 82.3% |
| Hispanics or Latinos | 0.0 /100 | #312 | Tragic 82.2% |
Demographics Similar to Russians by In Labor Force | Age 25-29
In terms of in labor force | age 25-29, the demographic groups most similar to Russians are Immigrants from Australia (85.3%, a difference of 0.010%), Kenyan (85.4%, a difference of 0.030%), Immigrants from Sweden (85.4%, a difference of 0.040%), Soviet Union (85.3%, a difference of 0.040%), and Menominee (85.4%, a difference of 0.050%).
| Demographics | Rating | Rank | In Labor Force | Age 25-29 |
| Immigrants | Scotland | 99.3 /100 | #66 | Exceptional 85.4% |
| Immigrants | Turkey | 99.2 /100 | #67 | Exceptional 85.4% |
| Immigrants | Cameroon | 99.2 /100 | #68 | Exceptional 85.4% |
| Menominee | 99.1 /100 | #69 | Exceptional 85.4% |
| Immigrants | Sweden | 99.1 /100 | #70 | Exceptional 85.4% |
| Kenyans | 99.0 /100 | #71 | Exceptional 85.4% |
| Immigrants | Australia | 98.9 /100 | #72 | Exceptional 85.3% |
| Russians | 98.8 /100 | #73 | Exceptional 85.3% |
| Soviet Union | 98.5 /100 | #74 | Exceptional 85.3% |
| Brazilians | 98.3 /100 | #75 | Exceptional 85.3% |
| Germans | 98.1 /100 | #76 | Exceptional 85.3% |
| Immigrants | South Central Asia | 97.9 /100 | #77 | Exceptional 85.2% |
| Immigrants | Egypt | 97.7 /100 | #78 | Exceptional 85.2% |
| Immigrants | Northern Africa | 97.6 /100 | #79 | Exceptional 85.2% |
| Immigrants | Zimbabwe | 97.6 /100 | #80 | Exceptional 85.2% |