Black/African American vs Tlingit-Haida Median Female Earnings
COMPARE
Black/African American
Tlingit-Haida
Median Female Earnings
Median Female Earnings Comparison
Blacks/African Americans
Tlingit-Haida
$35,315
MEDIAN FEMALE EARNINGS
0.0/ 100
METRIC RATING
302nd/ 347
METRIC RANK
$39,513
MEDIAN FEMALE EARNINGS
40.5/ 100
METRIC RATING
182nd/ 347
METRIC RANK
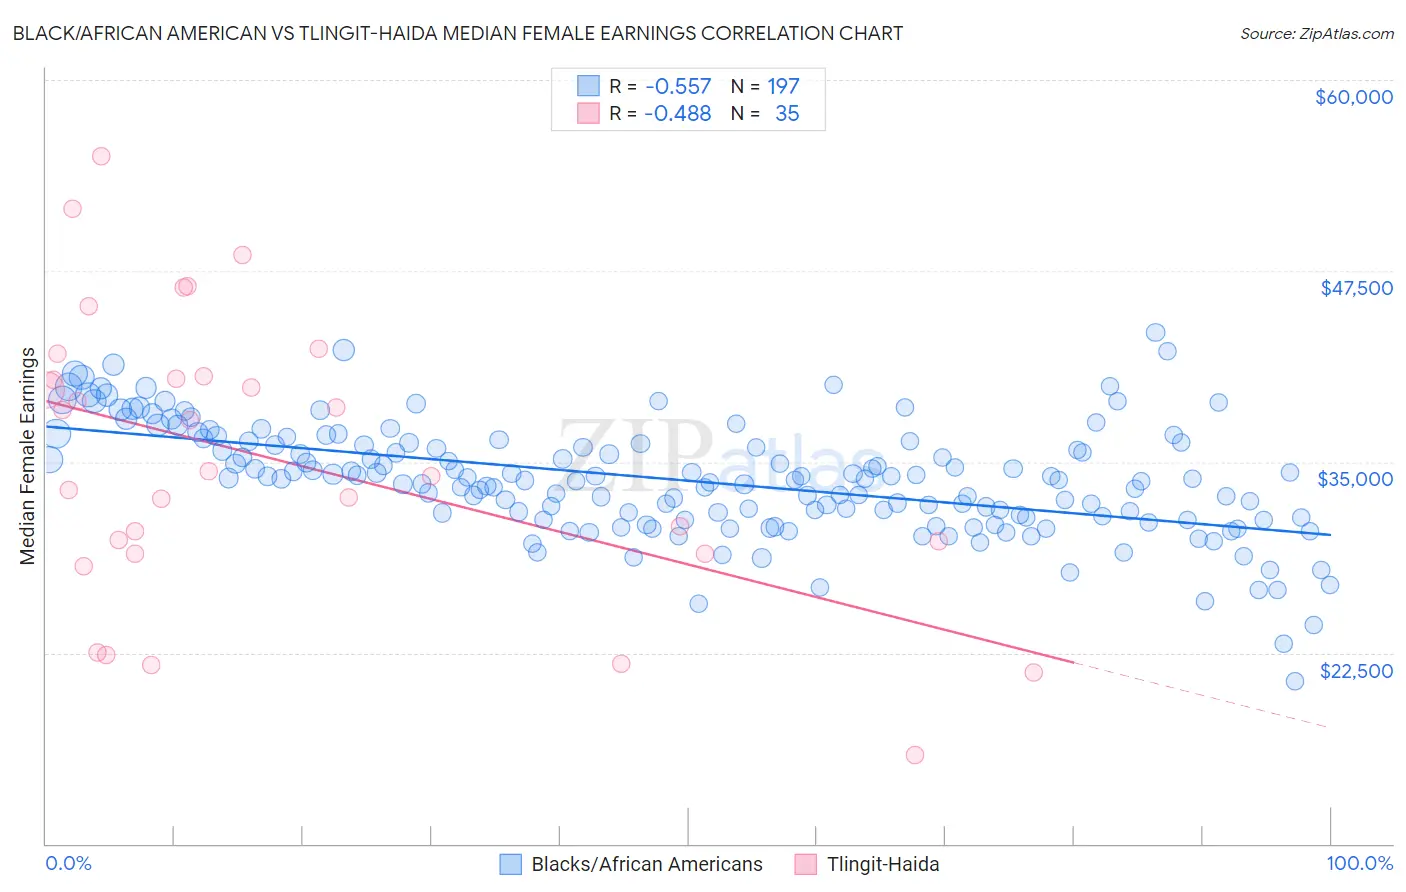
Black/African American vs Tlingit-Haida Median Female Earnings Correlation Chart
The statistical analysis conducted on geographies consisting of 562,880,101 people shows a substantial negative correlation between the proportion of Blacks/African Americans and median female earnings in the United States with a correlation coefficient (R) of -0.557 and weighted average of $35,315. Similarly, the statistical analysis conducted on geographies consisting of 60,850,593 people shows a moderate negative correlation between the proportion of Tlingit-Haida and median female earnings in the United States with a correlation coefficient (R) of -0.488 and weighted average of $39,513, a difference of 11.9%.
Median Female Earnings Correlation Summary
| Measurement | Black/African American | Tlingit-Haida |
| Minimum | $20,616 | $15,833 |
| Maximum | $43,481 | $55,000 |
| Range | $22,865 | $39,167 |
| Mean | $33,784 | $35,190 |
| Median | $33,890 | $34,397 |
| Interquartile 25% (IQ1) | $31,353 | $28,977 |
| Interquartile 75% (IQ3) | $36,250 | $40,590 |
| Interquartile Range (IQR) | $4,897 | $11,613 |
| Standard Deviation (Sample) | $3,688 | $9,336 |
| Standard Deviation (Population) | $3,678 | $9,202 |
Similar Demographics by Median Female Earnings
Demographics Similar to Blacks/African Americans by Median Female Earnings
In terms of median female earnings, the demographic groups most similar to Blacks/African Americans are Immigrants from Latin America ($35,307, a difference of 0.020%), Pima ($35,326, a difference of 0.030%), Crow ($35,266, a difference of 0.14%), Yuman ($35,377, a difference of 0.18%), and Immigrants from Guatemala ($35,444, a difference of 0.36%).
| Demographics | Rating | Rank | Median Female Earnings |
| Comanche | 0.0 /100 | #295 | Tragic $35,661 |
| Mexican American Indians | 0.0 /100 | #296 | Tragic $35,629 |
| Hmong | 0.0 /100 | #297 | Tragic $35,498 |
| Immigrants | Micronesia | 0.0 /100 | #298 | Tragic $35,477 |
| Immigrants | Guatemala | 0.0 /100 | #299 | Tragic $35,444 |
| Yuman | 0.0 /100 | #300 | Tragic $35,377 |
| Pima | 0.0 /100 | #301 | Tragic $35,326 |
| Blacks/African Americans | 0.0 /100 | #302 | Tragic $35,315 |
| Immigrants | Latin America | 0.0 /100 | #303 | Tragic $35,307 |
| Crow | 0.0 /100 | #304 | Tragic $35,266 |
| Bahamians | 0.0 /100 | #305 | Tragic $35,125 |
| Fijians | 0.0 /100 | #306 | Tragic $35,114 |
| Sioux | 0.0 /100 | #307 | Tragic $35,063 |
| Immigrants | Bahamas | 0.0 /100 | #308 | Tragic $35,027 |
| Hondurans | 0.0 /100 | #309 | Tragic $35,013 |
Demographics Similar to Tlingit-Haida by Median Female Earnings
In terms of median female earnings, the demographic groups most similar to Tlingit-Haida are Hungarian ($39,510, a difference of 0.010%), Tsimshian ($39,530, a difference of 0.050%), Immigrants from Kenya ($39,535, a difference of 0.060%), European ($39,457, a difference of 0.14%), and Immigrants from West Indies ($39,441, a difference of 0.18%).
| Demographics | Rating | Rank | Median Female Earnings |
| Immigrants | South America | 47.2 /100 | #175 | Average $39,643 |
| Nigerians | 47.0 /100 | #176 | Average $39,641 |
| Costa Ricans | 46.1 /100 | #177 | Average $39,622 |
| Slavs | 45.6 /100 | #178 | Average $39,613 |
| Immigrants | Germany | 45.1 /100 | #179 | Average $39,603 |
| Immigrants | Kenya | 41.6 /100 | #180 | Average $39,535 |
| Tsimshian | 41.4 /100 | #181 | Average $39,530 |
| Tlingit-Haida | 40.5 /100 | #182 | Average $39,513 |
| Hungarians | 40.3 /100 | #183 | Average $39,510 |
| Europeans | 37.7 /100 | #184 | Fair $39,457 |
| Immigrants | West Indies | 36.9 /100 | #185 | Fair $39,441 |
| Colombians | 36.9 /100 | #186 | Fair $39,439 |
| Swedes | 36.0 /100 | #187 | Fair $39,421 |
| Bermudans | 35.9 /100 | #188 | Fair $39,418 |
| Senegalese | 34.2 /100 | #189 | Fair $39,384 |