Black/African American vs Immigrants from Turkey GED/Equivalency
COMPARE
Black/African American
Immigrants from Turkey
GED/Equivalency
GED/Equivalency Comparison
Blacks/African Americans
Immigrants from Turkey
82.8%
GED/EQUIVALENCY
0.1/ 100
METRIC RATING
276th/ 347
METRIC RANK
87.9%
GED/EQUIVALENCY
99.2/ 100
METRIC RATING
63rd/ 347
METRIC RANK
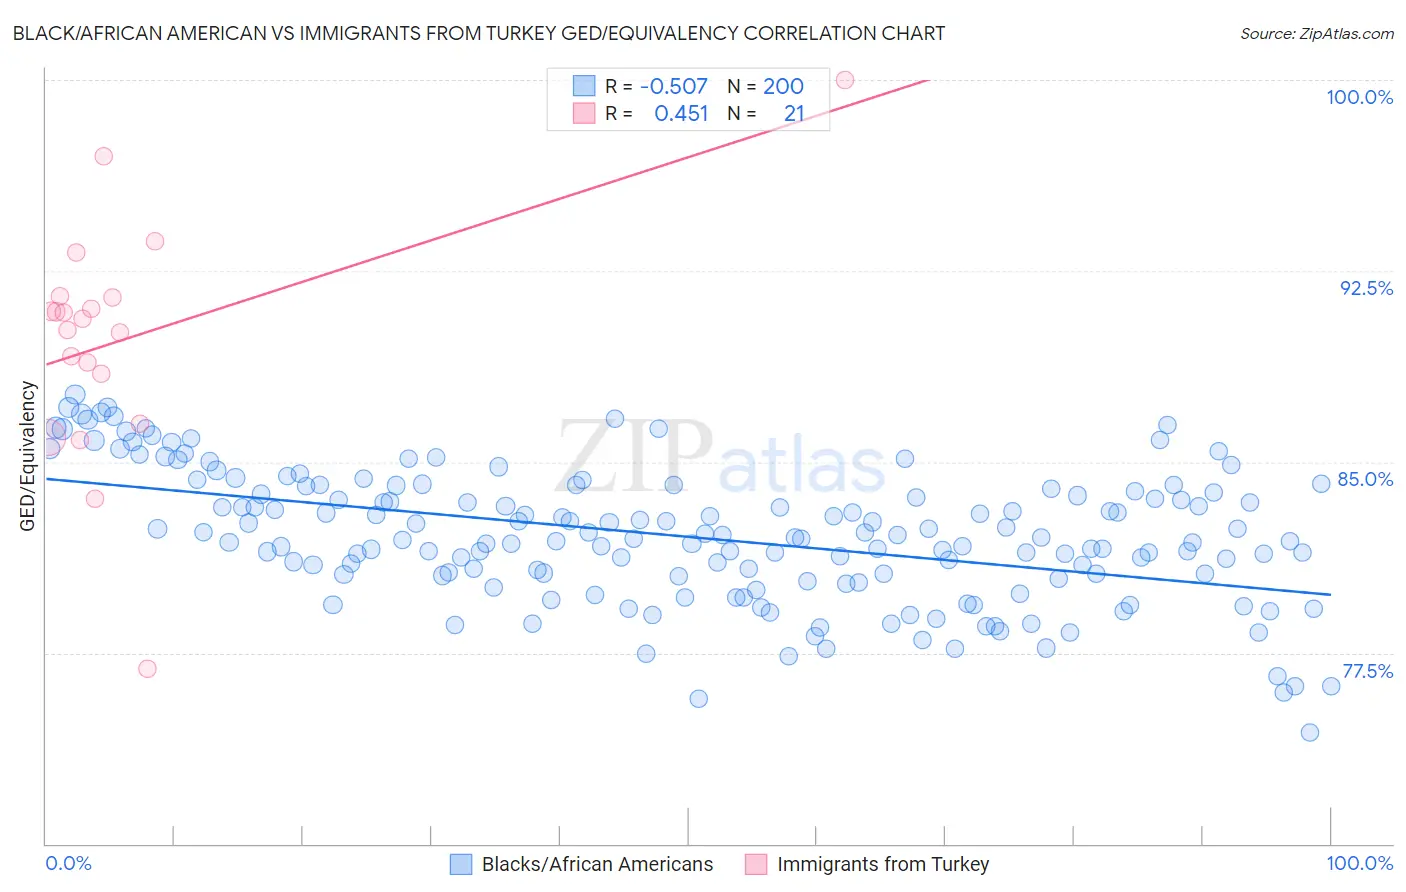
Black/African American vs Immigrants from Turkey GED/Equivalency Correlation Chart
The statistical analysis conducted on geographies consisting of 566,048,035 people shows a substantial negative correlation between the proportion of Blacks/African Americans and percentage of population with at least ged/equivalency education in the United States with a correlation coefficient (R) of -0.507 and weighted average of 82.8%. Similarly, the statistical analysis conducted on geographies consisting of 223,057,775 people shows a moderate positive correlation between the proportion of Immigrants from Turkey and percentage of population with at least ged/equivalency education in the United States with a correlation coefficient (R) of 0.451 and weighted average of 87.9%, a difference of 6.2%.
GED/Equivalency Correlation Summary
| Measurement | Black/African American | Immigrants from Turkey |
| Minimum | 74.4% | 76.9% |
| Maximum | 87.6% | 100.0% |
| Range | 13.3% | 23.1% |
| Mean | 82.1% | 89.8% |
| Median | 82.0% | 90.6% |
| Interquartile 25% (IQ1) | 80.5% | 87.5% |
| Interquartile 75% (IQ3) | 83.8% | 91.5% |
| Interquartile Range (IQR) | 3.3% | 4.0% |
| Standard Deviation (Sample) | 2.6% | 4.7% |
| Standard Deviation (Population) | 2.6% | 4.6% |
Similar Demographics by GED/Equivalency
Demographics Similar to Blacks/African Americans by GED/Equivalency
In terms of ged/equivalency, the demographic groups most similar to Blacks/African Americans are Seminole (82.8%, a difference of 0.020%), Arapaho (82.8%, a difference of 0.020%), Immigrants from Laos (82.7%, a difference of 0.050%), Immigrants from Fiji (82.7%, a difference of 0.060%), and Cheyenne (82.7%, a difference of 0.060%).
| Demographics | Rating | Rank | GED/Equivalency |
| Hopi | 0.2 /100 | #269 | Tragic 83.0% |
| Immigrants | Jamaica | 0.2 /100 | #270 | Tragic 82.9% |
| U.S. Virgin Islanders | 0.2 /100 | #271 | Tragic 82.9% |
| Barbadians | 0.1 /100 | #272 | Tragic 82.9% |
| Pennsylvania Germans | 0.1 /100 | #273 | Tragic 82.9% |
| Immigrants | Trinidad and Tobago | 0.1 /100 | #274 | Tragic 82.8% |
| Seminole | 0.1 /100 | #275 | Tragic 82.8% |
| Blacks/African Americans | 0.1 /100 | #276 | Tragic 82.8% |
| Arapaho | 0.1 /100 | #277 | Tragic 82.8% |
| Immigrants | Laos | 0.1 /100 | #278 | Tragic 82.7% |
| Immigrants | Fiji | 0.1 /100 | #279 | Tragic 82.7% |
| Cheyenne | 0.1 /100 | #280 | Tragic 82.7% |
| Sioux | 0.1 /100 | #281 | Tragic 82.6% |
| Immigrants | Immigrants | 0.1 /100 | #282 | Tragic 82.6% |
| Indonesians | 0.1 /100 | #283 | Tragic 82.5% |
Demographics Similar to Immigrants from Turkey by GED/Equivalency
In terms of ged/equivalency, the demographic groups most similar to Immigrants from Turkey are German (87.9%, a difference of 0.010%), Scandinavian (87.9%, a difference of 0.030%), European (87.9%, a difference of 0.030%), Serbian (87.9%, a difference of 0.040%), and Immigrants from Canada (87.9%, a difference of 0.040%).
| Demographics | Rating | Rank | GED/Equivalency |
| Immigrants | Denmark | 99.4 /100 | #56 | Exceptional 88.0% |
| Immigrants | Czechoslovakia | 99.3 /100 | #57 | Exceptional 87.9% |
| Northern Europeans | 99.3 /100 | #58 | Exceptional 87.9% |
| Serbians | 99.3 /100 | #59 | Exceptional 87.9% |
| Scandinavians | 99.3 /100 | #60 | Exceptional 87.9% |
| Europeans | 99.3 /100 | #61 | Exceptional 87.9% |
| Germans | 99.3 /100 | #62 | Exceptional 87.9% |
| Immigrants | Turkey | 99.2 /100 | #63 | Exceptional 87.9% |
| Immigrants | Canada | 99.2 /100 | #64 | Exceptional 87.9% |
| Immigrants | North America | 99.1 /100 | #65 | Exceptional 87.8% |
| Immigrants | Bulgaria | 99.1 /100 | #66 | Exceptional 87.8% |
| British | 99.1 /100 | #67 | Exceptional 87.8% |
| Immigrants | France | 99.1 /100 | #68 | Exceptional 87.8% |
| Immigrants | Saudi Arabia | 99.0 /100 | #69 | Exceptional 87.8% |
| Ukrainians | 98.8 /100 | #70 | Exceptional 87.7% |