Blackfeet vs Choctaw Median Family Income
COMPARE
Blackfeet
Choctaw
Median Family Income
Median Family Income Comparison
Blackfeet
Choctaw
$88,717
MEDIAN FAMILY INCOME
0.1/ 100
METRIC RATING
281st/ 347
METRIC RANK
$84,835
MEDIAN FAMILY INCOME
0.0/ 100
METRIC RATING
313th/ 347
METRIC RANK
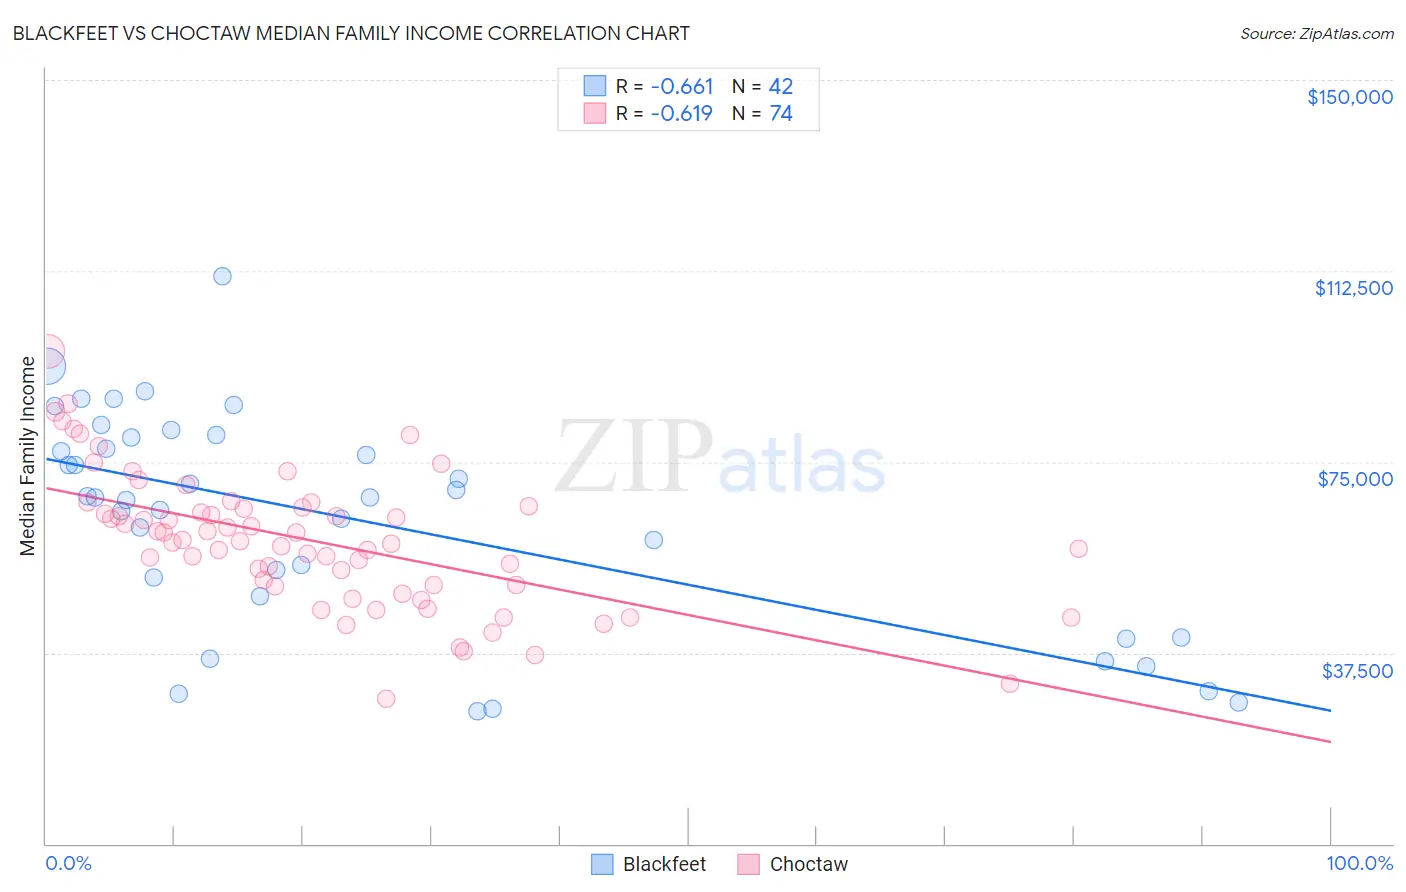
Blackfeet vs Choctaw Median Family Income Correlation Chart
The statistical analysis conducted on geographies consisting of 309,409,082 people shows a significant negative correlation between the proportion of Blackfeet and median family income in the United States with a correlation coefficient (R) of -0.661 and weighted average of $88,717. Similarly, the statistical analysis conducted on geographies consisting of 269,558,288 people shows a significant negative correlation between the proportion of Choctaw and median family income in the United States with a correlation coefficient (R) of -0.619 and weighted average of $84,835, a difference of 4.6%.
Median Family Income Correlation Summary
| Measurement | Blackfeet | Choctaw |
| Minimum | $26,000 | $28,571 |
| Maximum | $111,536 | $96,727 |
| Range | $85,536 | $68,156 |
| Mean | $63,847 | $59,567 |
| Median | $68,073 | $59,584 |
| Interquartile 25% (IQ1) | $48,694 | $50,833 |
| Interquartile 75% (IQ3) | $79,668 | $66,002 |
| Interquartile Range (IQR) | $30,974 | $15,169 |
| Standard Deviation (Sample) | $21,241 | $13,206 |
| Standard Deviation (Population) | $20,987 | $13,117 |
Similar Demographics by Median Family Income
Demographics Similar to Blackfeet by Median Family Income
In terms of median family income, the demographic groups most similar to Blackfeet are Comanche ($88,556, a difference of 0.18%), British West Indian ($88,987, a difference of 0.30%), Bangladeshi ($88,358, a difference of 0.41%), Indonesian ($88,301, a difference of 0.47%), and Guatemalan ($88,295, a difference of 0.48%).
| Demographics | Rating | Rank | Median Family Income |
| Spanish Americans | 0.2 /100 | #274 | Tragic $90,322 |
| Immigrants | St. Vincent and the Grenadines | 0.2 /100 | #275 | Tragic $90,094 |
| Immigrants | Zaire | 0.1 /100 | #276 | Tragic $89,285 |
| Immigrants | Jamaica | 0.1 /100 | #277 | Tragic $89,268 |
| Immigrants | Grenada | 0.1 /100 | #278 | Tragic $89,249 |
| Immigrants | Belize | 0.1 /100 | #279 | Tragic $89,197 |
| British West Indians | 0.1 /100 | #280 | Tragic $88,987 |
| Blackfeet | 0.1 /100 | #281 | Tragic $88,717 |
| Comanche | 0.1 /100 | #282 | Tragic $88,556 |
| Bangladeshis | 0.1 /100 | #283 | Tragic $88,358 |
| Indonesians | 0.1 /100 | #284 | Tragic $88,301 |
| Guatemalans | 0.1 /100 | #285 | Tragic $88,295 |
| Immigrants | Nicaragua | 0.1 /100 | #286 | Tragic $88,267 |
| Potawatomi | 0.1 /100 | #287 | Tragic $88,265 |
| Cherokee | 0.1 /100 | #288 | Tragic $88,209 |
Demographics Similar to Choctaw by Median Family Income
In terms of median family income, the demographic groups most similar to Choctaw are Immigrants from Bahamas ($84,732, a difference of 0.12%), Cuban ($84,981, a difference of 0.17%), Honduran ($85,004, a difference of 0.20%), Immigrants from Central America ($85,050, a difference of 0.25%), and Haitian ($85,218, a difference of 0.45%).
| Demographics | Rating | Rank | Median Family Income |
| Immigrants | Dominica | 0.0 /100 | #306 | Tragic $85,411 |
| Chickasaw | 0.0 /100 | #307 | Tragic $85,356 |
| U.S. Virgin Islanders | 0.0 /100 | #308 | Tragic $85,294 |
| Haitians | 0.0 /100 | #309 | Tragic $85,218 |
| Immigrants | Central America | 0.0 /100 | #310 | Tragic $85,050 |
| Hondurans | 0.0 /100 | #311 | Tragic $85,004 |
| Cubans | 0.0 /100 | #312 | Tragic $84,981 |
| Choctaw | 0.0 /100 | #313 | Tragic $84,835 |
| Immigrants | Bahamas | 0.0 /100 | #314 | Tragic $84,732 |
| Apache | 0.0 /100 | #315 | Tragic $84,451 |
| Immigrants | Haiti | 0.0 /100 | #316 | Tragic $84,018 |
| Yakama | 0.0 /100 | #317 | Tragic $83,932 |
| Immigrants | Mexico | 0.0 /100 | #318 | Tragic $83,639 |
| Immigrants | Honduras | 0.0 /100 | #319 | Tragic $83,618 |
| Seminole | 0.0 /100 | #320 | Tragic $83,354 |