Blackfeet vs Cherokee Median Family Income
COMPARE
Blackfeet
Cherokee
Median Family Income
Median Family Income Comparison
Blackfeet
Cherokee
$88,717
MEDIAN FAMILY INCOME
0.1/ 100
METRIC RATING
281st/ 347
METRIC RANK
$88,209
MEDIAN FAMILY INCOME
0.1/ 100
METRIC RATING
288th/ 347
METRIC RANK
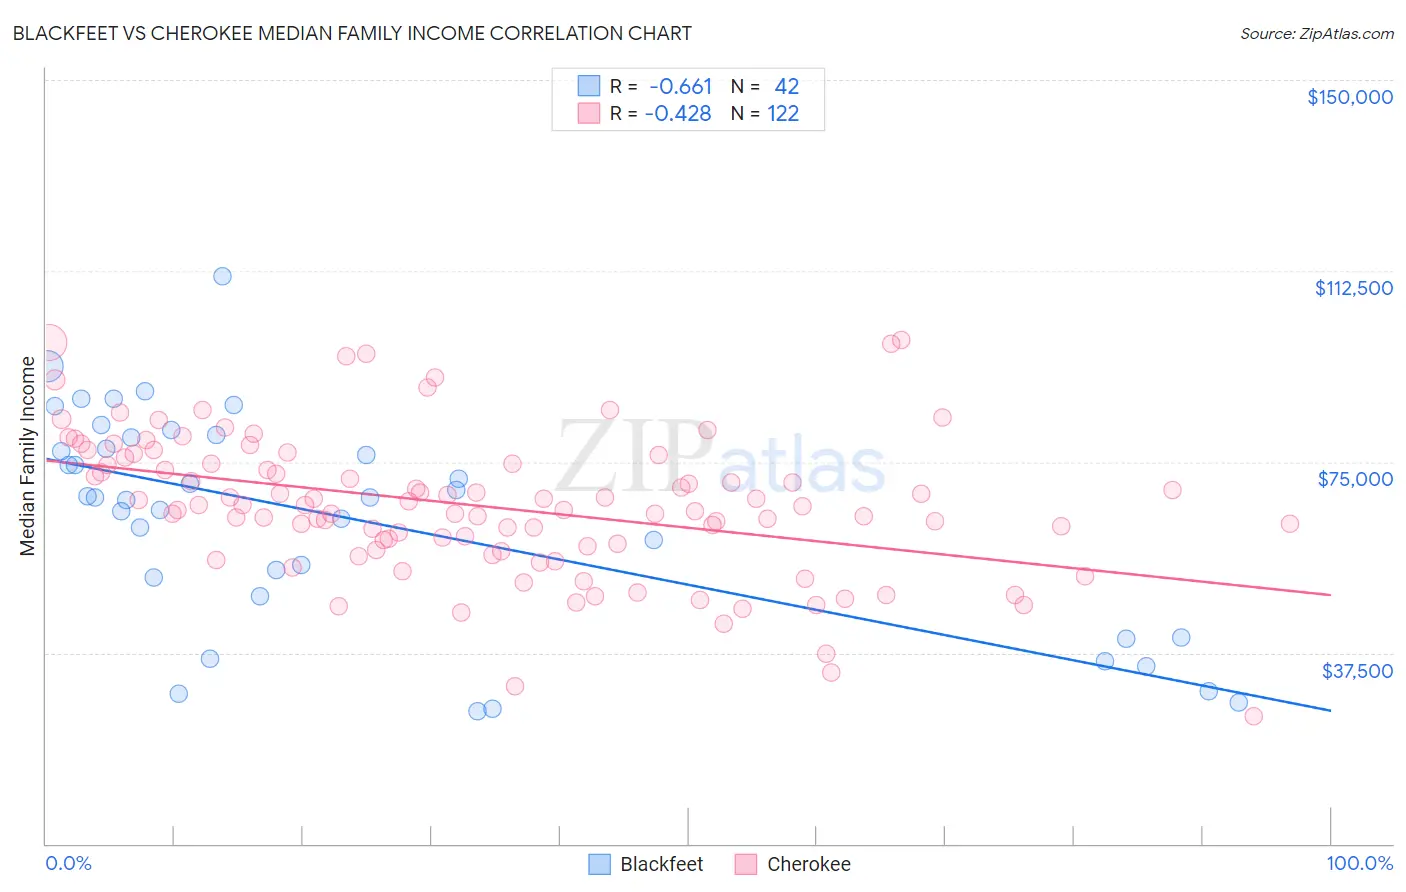
Blackfeet vs Cherokee Median Family Income Correlation Chart
The statistical analysis conducted on geographies consisting of 309,409,082 people shows a significant negative correlation between the proportion of Blackfeet and median family income in the United States with a correlation coefficient (R) of -0.661 and weighted average of $88,717. Similarly, the statistical analysis conducted on geographies consisting of 493,078,219 people shows a moderate negative correlation between the proportion of Cherokee and median family income in the United States with a correlation coefficient (R) of -0.428 and weighted average of $88,209, a difference of 0.58%.
Median Family Income Correlation Summary
| Measurement | Blackfeet | Cherokee |
| Minimum | $26,000 | $25,000 |
| Maximum | $111,536 | $98,929 |
| Range | $85,536 | $73,929 |
| Mean | $63,847 | $66,366 |
| Median | $68,073 | $66,333 |
| Interquartile 25% (IQ1) | $48,694 | $58,393 |
| Interquartile 75% (IQ3) | $79,668 | $74,712 |
| Interquartile Range (IQR) | $30,974 | $16,319 |
| Standard Deviation (Sample) | $21,241 | $13,972 |
| Standard Deviation (Population) | $20,987 | $13,915 |
Demographics Similar to Blackfeet and Cherokee by Median Family Income
In terms of median family income, the demographic groups most similar to Blackfeet are Comanche ($88,556, a difference of 0.18%), British West Indian ($88,987, a difference of 0.30%), Bangladeshi ($88,358, a difference of 0.41%), Indonesian ($88,301, a difference of 0.47%), and Guatemalan ($88,295, a difference of 0.48%). Similarly, the demographic groups most similar to Cherokee are Potawatomi ($88,265, a difference of 0.060%), Immigrants from Nicaragua ($88,267, a difference of 0.070%), Indonesian ($88,301, a difference of 0.10%), Guatemalan ($88,295, a difference of 0.10%), and Bangladeshi ($88,358, a difference of 0.17%).
| Demographics | Rating | Rank | Median Family Income |
| Spanish Americans | 0.2 /100 | #274 | Tragic $90,322 |
| Immigrants | St. Vincent and the Grenadines | 0.2 /100 | #275 | Tragic $90,094 |
| Immigrants | Zaire | 0.1 /100 | #276 | Tragic $89,285 |
| Immigrants | Jamaica | 0.1 /100 | #277 | Tragic $89,268 |
| Immigrants | Grenada | 0.1 /100 | #278 | Tragic $89,249 |
| Immigrants | Belize | 0.1 /100 | #279 | Tragic $89,197 |
| British West Indians | 0.1 /100 | #280 | Tragic $88,987 |
| Blackfeet | 0.1 /100 | #281 | Tragic $88,717 |
| Comanche | 0.1 /100 | #282 | Tragic $88,556 |
| Bangladeshis | 0.1 /100 | #283 | Tragic $88,358 |
| Indonesians | 0.1 /100 | #284 | Tragic $88,301 |
| Guatemalans | 0.1 /100 | #285 | Tragic $88,295 |
| Immigrants | Nicaragua | 0.1 /100 | #286 | Tragic $88,267 |
| Potawatomi | 0.1 /100 | #287 | Tragic $88,265 |
| Cherokee | 0.1 /100 | #288 | Tragic $88,209 |
| Central American Indians | 0.1 /100 | #289 | Tragic $88,034 |
| Shoshone | 0.1 /100 | #290 | Tragic $87,872 |
| Immigrants | Cabo Verde | 0.1 /100 | #291 | Tragic $87,830 |
| Africans | 0.1 /100 | #292 | Tragic $87,820 |
| Ute | 0.0 /100 | #293 | Tragic $87,596 |
| Fijians | 0.0 /100 | #294 | Tragic $87,387 |