Blackfeet vs Immigrants from Grenada Median Family Income
COMPARE
Blackfeet
Immigrants from Grenada
Median Family Income
Median Family Income Comparison
Blackfeet
Immigrants from Grenada
$88,717
MEDIAN FAMILY INCOME
0.1/ 100
METRIC RATING
281st/ 347
METRIC RANK
$89,249
MEDIAN FAMILY INCOME
0.1/ 100
METRIC RATING
278th/ 347
METRIC RANK
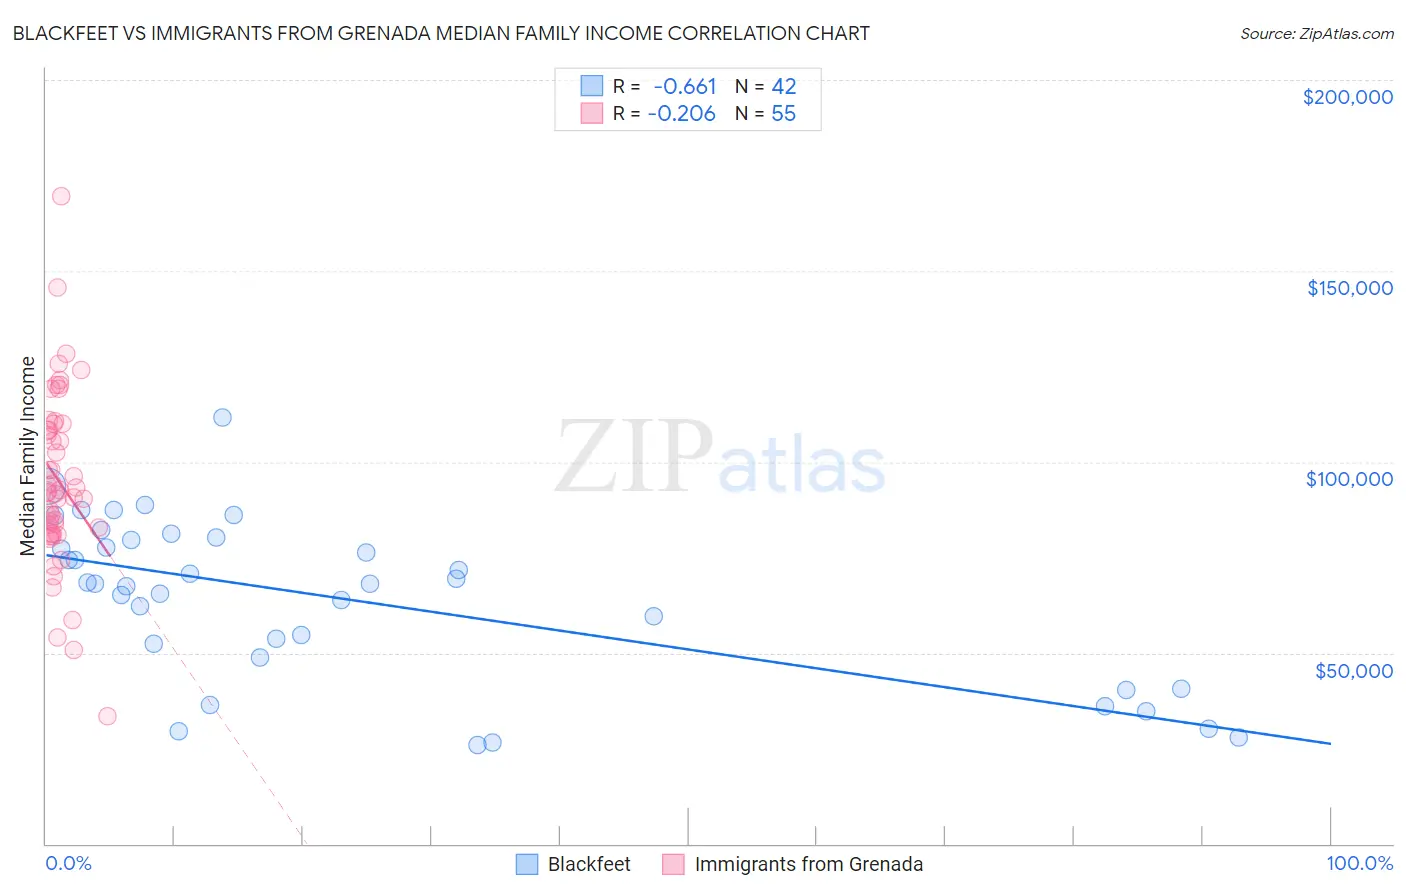
Blackfeet vs Immigrants from Grenada Median Family Income Correlation Chart
The statistical analysis conducted on geographies consisting of 309,409,082 people shows a significant negative correlation between the proportion of Blackfeet and median family income in the United States with a correlation coefficient (R) of -0.661 and weighted average of $88,717. Similarly, the statistical analysis conducted on geographies consisting of 67,181,093 people shows a weak negative correlation between the proportion of Immigrants from Grenada and median family income in the United States with a correlation coefficient (R) of -0.206 and weighted average of $89,249, a difference of 0.60%.
Median Family Income Correlation Summary
| Measurement | Blackfeet | Immigrants from Grenada |
| Minimum | $26,000 | $33,250 |
| Maximum | $111,536 | $169,583 |
| Range | $85,536 | $136,333 |
| Mean | $63,847 | $95,083 |
| Median | $68,073 | $92,174 |
| Interquartile 25% (IQ1) | $48,694 | $81,230 |
| Interquartile 75% (IQ3) | $79,668 | $109,949 |
| Interquartile Range (IQR) | $30,974 | $28,718 |
| Standard Deviation (Sample) | $21,241 | $23,232 |
| Standard Deviation (Population) | $20,987 | $23,020 |
Demographics Similar to Blackfeet and Immigrants from Grenada by Median Family Income
In terms of median family income, the demographic groups most similar to Blackfeet are Comanche ($88,556, a difference of 0.18%), British West Indian ($88,987, a difference of 0.30%), Bangladeshi ($88,358, a difference of 0.41%), Indonesian ($88,301, a difference of 0.47%), and Guatemalan ($88,295, a difference of 0.48%). Similarly, the demographic groups most similar to Immigrants from Grenada are Immigrants from Jamaica ($89,268, a difference of 0.020%), Immigrants from Zaire ($89,285, a difference of 0.040%), Immigrants from Belize ($89,197, a difference of 0.060%), British West Indian ($88,987, a difference of 0.29%), and Comanche ($88,556, a difference of 0.78%).
| Demographics | Rating | Rank | Median Family Income |
| Belizeans | 0.2 /100 | #269 | Tragic $90,880 |
| Jamaicans | 0.2 /100 | #270 | Tragic $90,581 |
| Iroquois | 0.2 /100 | #271 | Tragic $90,543 |
| Immigrants | Liberia | 0.2 /100 | #272 | Tragic $90,450 |
| Immigrants | Micronesia | 0.2 /100 | #273 | Tragic $90,345 |
| Spanish Americans | 0.2 /100 | #274 | Tragic $90,322 |
| Immigrants | St. Vincent and the Grenadines | 0.2 /100 | #275 | Tragic $90,094 |
| Immigrants | Zaire | 0.1 /100 | #276 | Tragic $89,285 |
| Immigrants | Jamaica | 0.1 /100 | #277 | Tragic $89,268 |
| Immigrants | Grenada | 0.1 /100 | #278 | Tragic $89,249 |
| Immigrants | Belize | 0.1 /100 | #279 | Tragic $89,197 |
| British West Indians | 0.1 /100 | #280 | Tragic $88,987 |
| Blackfeet | 0.1 /100 | #281 | Tragic $88,717 |
| Comanche | 0.1 /100 | #282 | Tragic $88,556 |
| Bangladeshis | 0.1 /100 | #283 | Tragic $88,358 |
| Indonesians | 0.1 /100 | #284 | Tragic $88,301 |
| Guatemalans | 0.1 /100 | #285 | Tragic $88,295 |
| Immigrants | Nicaragua | 0.1 /100 | #286 | Tragic $88,267 |
| Potawatomi | 0.1 /100 | #287 | Tragic $88,265 |
| Cherokee | 0.1 /100 | #288 | Tragic $88,209 |
| Central American Indians | 0.1 /100 | #289 | Tragic $88,034 |