Immigrants from Uruguay vs French Canadian Per Capita Income
COMPARE
Immigrants from Uruguay
French Canadian
Per Capita Income
Per Capita Income Comparison
Immigrants from Uruguay
French Canadians
$43,997
PER CAPITA INCOME
59.3/ 100
METRIC RATING
166th/ 347
METRIC RANK
$43,003
PER CAPITA INCOME
32.3/ 100
METRIC RATING
186th/ 347
METRIC RANK
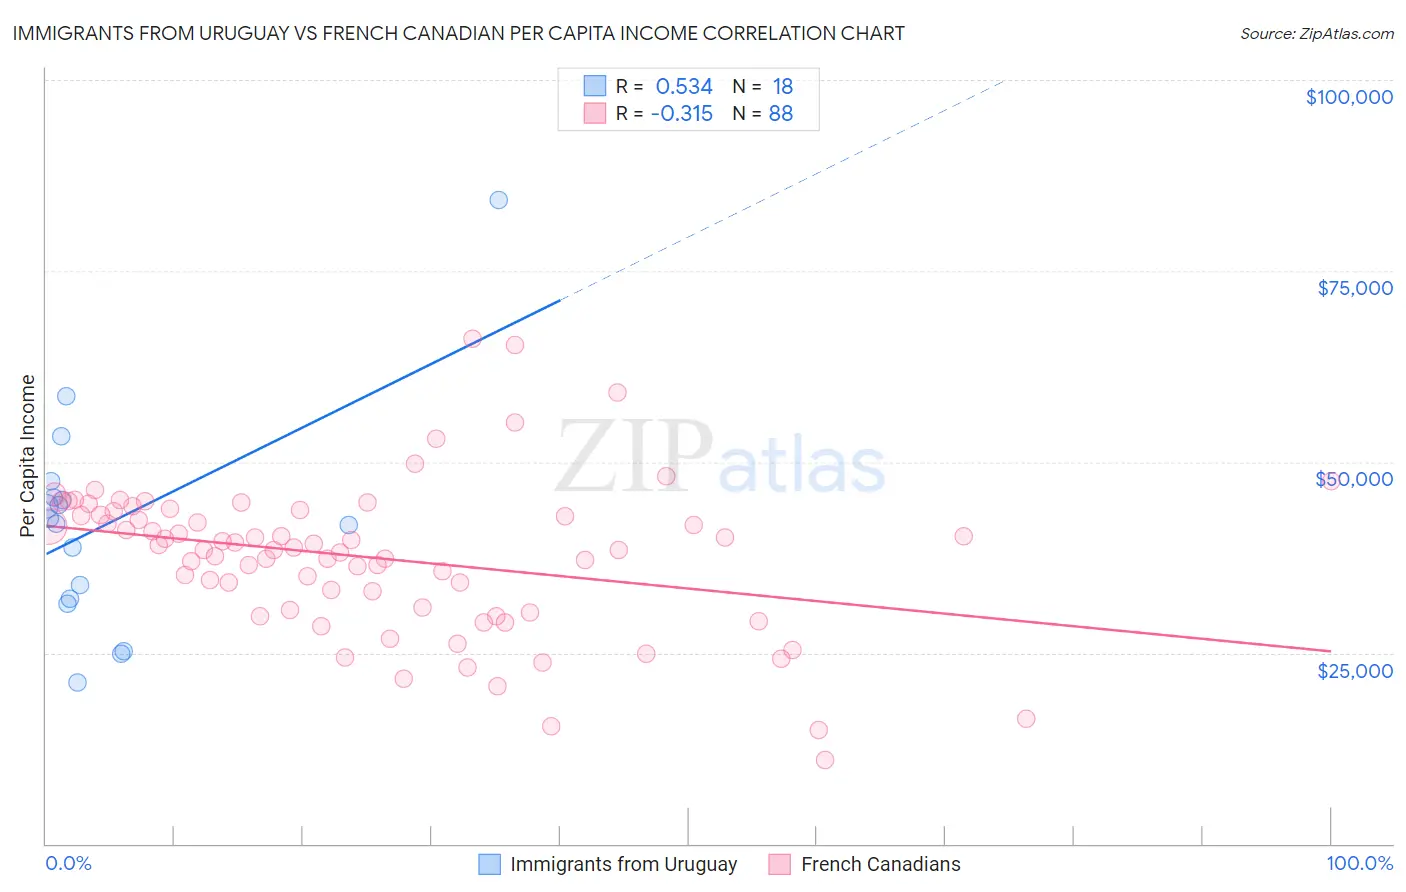
Immigrants from Uruguay vs French Canadian Per Capita Income Correlation Chart
The statistical analysis conducted on geographies consisting of 133,259,667 people shows a substantial positive correlation between the proportion of Immigrants from Uruguay and per capita income in the United States with a correlation coefficient (R) of 0.534 and weighted average of $43,997. Similarly, the statistical analysis conducted on geographies consisting of 502,704,545 people shows a mild negative correlation between the proportion of French Canadians and per capita income in the United States with a correlation coefficient (R) of -0.315 and weighted average of $43,003, a difference of 2.3%.
Per Capita Income Correlation Summary
| Measurement | Immigrants from Uruguay | French Canadian |
| Minimum | $21,194 | $10,964 |
| Maximum | $84,313 | $66,177 |
| Range | $63,119 | $55,213 |
| Mean | $42,012 | $37,443 |
| Median | $42,230 | $38,631 |
| Interquartile 25% (IQ1) | $32,137 | $30,758 |
| Interquartile 75% (IQ3) | $45,280 | $43,262 |
| Interquartile Range (IQR) | $13,143 | $12,504 |
| Standard Deviation (Sample) | $14,447 | $9,955 |
| Standard Deviation (Population) | $14,040 | $9,898 |
Demographics Similar to Immigrants from Uruguay and French Canadians by Per Capita Income
In terms of per capita income, the demographic groups most similar to Immigrants from Uruguay are English ($43,982, a difference of 0.030%), Belgian ($43,951, a difference of 0.10%), Immigrants from Peru ($43,852, a difference of 0.33%), Scandinavian ($43,848, a difference of 0.34%), and Immigrants from Eastern Africa ($43,838, a difference of 0.36%). Similarly, the demographic groups most similar to French Canadians are Immigrants ($43,010, a difference of 0.020%), Spaniard ($43,028, a difference of 0.060%), German ($43,067, a difference of 0.15%), Immigrants from Vietnam ($43,229, a difference of 0.53%), and Welsh ($43,233, a difference of 0.54%).
| Demographics | Rating | Rank | Per Capita Income |
| Immigrants | Uruguay | 59.3 /100 | #166 | Average $43,997 |
| English | 58.9 /100 | #167 | Average $43,982 |
| Belgians | 58.1 /100 | #168 | Average $43,951 |
| Immigrants | Peru | 55.3 /100 | #169 | Average $43,852 |
| Scandinavians | 55.2 /100 | #170 | Average $43,848 |
| Immigrants | Eastern Africa | 54.9 /100 | #171 | Average $43,838 |
| Czechoslovakians | 54.1 /100 | #172 | Average $43,806 |
| French | 50.7 /100 | #173 | Average $43,685 |
| Colombians | 50.0 /100 | #174 | Average $43,661 |
| Celtics | 48.9 /100 | #175 | Average $43,621 |
| Immigrants | South Eastern Asia | 46.6 /100 | #176 | Average $43,539 |
| Tlingit-Haida | 45.9 /100 | #177 | Average $43,516 |
| Immigrants | Costa Rica | 44.5 /100 | #178 | Average $43,464 |
| Finns | 44.4 /100 | #179 | Average $43,461 |
| Sierra Leoneans | 42.9 /100 | #180 | Average $43,405 |
| Welsh | 38.2 /100 | #181 | Fair $43,233 |
| Immigrants | Vietnam | 38.1 /100 | #182 | Fair $43,229 |
| Germans | 33.9 /100 | #183 | Fair $43,067 |
| Spaniards | 32.9 /100 | #184 | Fair $43,028 |
| Immigrants | Immigrants | 32.5 /100 | #185 | Fair $43,010 |
| French Canadians | 32.3 /100 | #186 | Fair $43,003 |