Bermudan vs Immigrants from Honduras Median Male Earnings
COMPARE
Bermudan
Immigrants from Honduras
Median Male Earnings
Median Male Earnings Comparison
Bermudans
Immigrants from Honduras
$52,465
MEDIAN MALE EARNINGS
12.1/ 100
METRIC RATING
209th/ 347
METRIC RANK
$45,787
MEDIAN MALE EARNINGS
0.0/ 100
METRIC RATING
320th/ 347
METRIC RANK
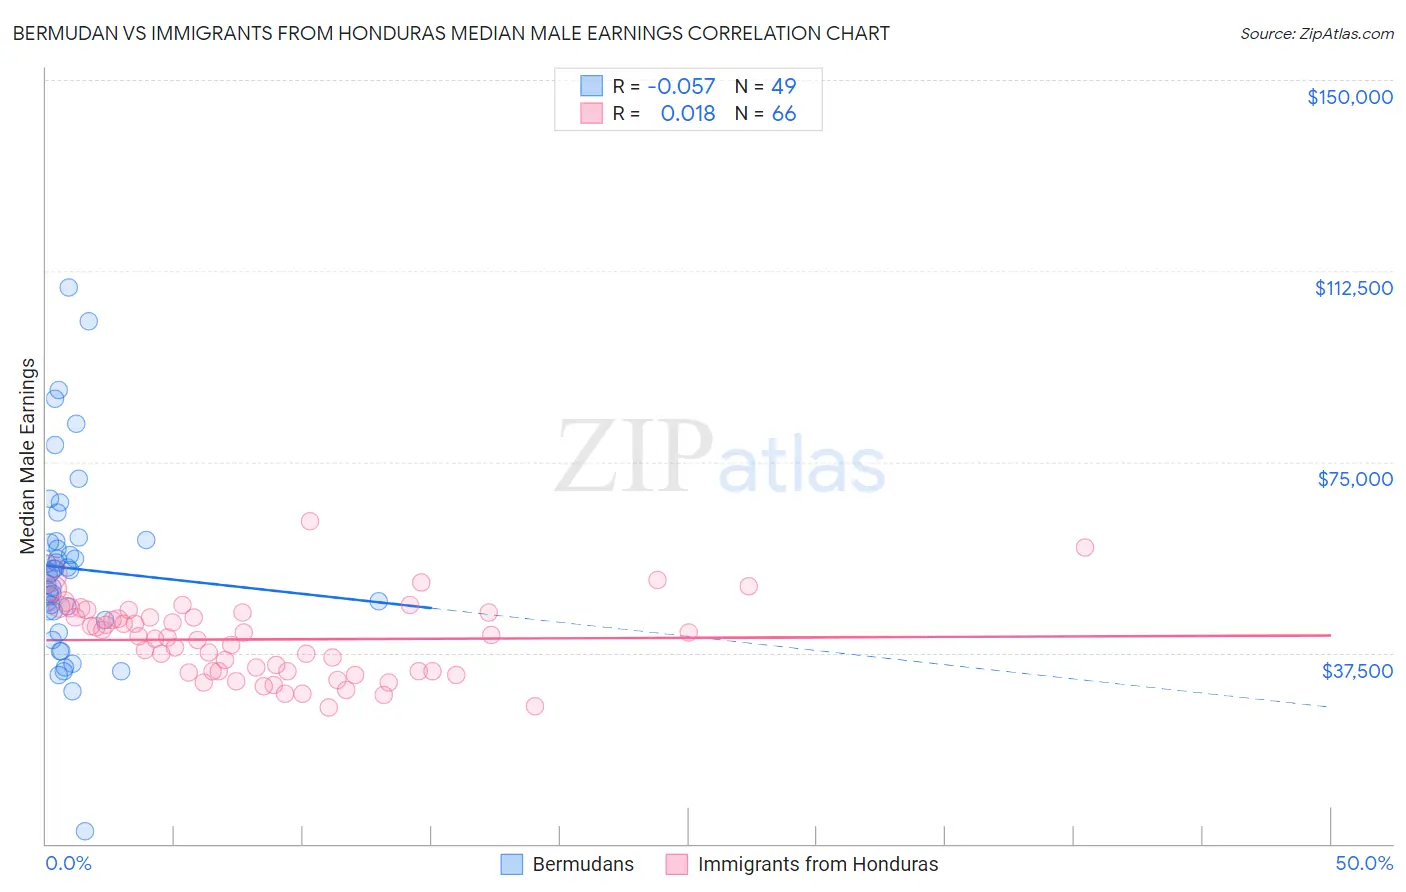
Bermudan vs Immigrants from Honduras Median Male Earnings Correlation Chart
The statistical analysis conducted on geographies consisting of 55,727,224 people shows a slight negative correlation between the proportion of Bermudans and median male earnings in the United States with a correlation coefficient (R) of -0.057 and weighted average of $52,465. Similarly, the statistical analysis conducted on geographies consisting of 322,554,949 people shows no correlation between the proportion of Immigrants from Honduras and median male earnings in the United States with a correlation coefficient (R) of 0.018 and weighted average of $45,787, a difference of 14.6%.
Median Male Earnings Correlation Summary
| Measurement | Bermudan | Immigrants from Honduras |
| Minimum | $2,499 | $26,786 |
| Maximum | $109,250 | $63,286 |
| Range | $106,751 | $36,500 |
| Mean | $54,094 | $40,153 |
| Median | $53,290 | $40,629 |
| Interquartile 25% (IQ1) | $44,820 | $33,830 |
| Interquartile 75% (IQ3) | $59,519 | $45,376 |
| Interquartile Range (IQR) | $14,700 | $11,546 |
| Standard Deviation (Sample) | $18,662 | $7,556 |
| Standard Deviation (Population) | $18,471 | $7,498 |
Similar Demographics by Median Male Earnings
Demographics Similar to Bermudans by Median Male Earnings
In terms of median male earnings, the demographic groups most similar to Bermudans are Venezuelan ($52,510, a difference of 0.090%), Delaware ($52,412, a difference of 0.10%), Vietnamese ($52,525, a difference of 0.11%), Tlingit-Haida ($52,409, a difference of 0.11%), and Cajun ($52,325, a difference of 0.27%).
| Demographics | Rating | Rank | Median Male Earnings |
| Immigrants | Uruguay | 16.8 /100 | #202 | Poor $52,860 |
| Panamanians | 16.5 /100 | #203 | Poor $52,835 |
| Ghanaians | 16.1 /100 | #204 | Poor $52,810 |
| Immigrants | Colombia | 15.0 /100 | #205 | Poor $52,725 |
| Immigrants | Iraq | 14.5 /100 | #206 | Poor $52,681 |
| Vietnamese | 12.7 /100 | #207 | Poor $52,525 |
| Venezuelans | 12.5 /100 | #208 | Poor $52,510 |
| Bermudans | 12.1 /100 | #209 | Poor $52,465 |
| Delaware | 11.5 /100 | #210 | Poor $52,412 |
| Tlingit-Haida | 11.5 /100 | #211 | Poor $52,409 |
| Cajuns | 10.7 /100 | #212 | Poor $52,325 |
| Native Hawaiians | 10.5 /100 | #213 | Poor $52,306 |
| Immigrants | Nonimmigrants | 9.3 /100 | #214 | Tragic $52,170 |
| Immigrants | Cameroon | 8.9 /100 | #215 | Tragic $52,119 |
| Immigrants | Venezuela | 8.3 /100 | #216 | Tragic $52,041 |
Demographics Similar to Immigrants from Honduras by Median Male Earnings
In terms of median male earnings, the demographic groups most similar to Immigrants from Honduras are Haitian ($45,903, a difference of 0.25%), Fijian ($45,607, a difference of 0.39%), Sioux ($45,566, a difference of 0.48%), Immigrants from Central America ($45,538, a difference of 0.55%), and Black/African American ($45,523, a difference of 0.58%).
| Demographics | Rating | Rank | Median Male Earnings |
| Hondurans | 0.0 /100 | #313 | Tragic $46,374 |
| Chippewa | 0.0 /100 | #314 | Tragic $46,368 |
| Immigrants | Guatemala | 0.0 /100 | #315 | Tragic $46,244 |
| Immigrants | Caribbean | 0.0 /100 | #316 | Tragic $46,193 |
| Mexicans | 0.0 /100 | #317 | Tragic $46,147 |
| Cheyenne | 0.0 /100 | #318 | Tragic $46,062 |
| Haitians | 0.0 /100 | #319 | Tragic $45,903 |
| Immigrants | Honduras | 0.0 /100 | #320 | Tragic $45,787 |
| Fijians | 0.0 /100 | #321 | Tragic $45,607 |
| Sioux | 0.0 /100 | #322 | Tragic $45,566 |
| Immigrants | Central America | 0.0 /100 | #323 | Tragic $45,538 |
| Blacks/African Americans | 0.0 /100 | #324 | Tragic $45,523 |
| Yuman | 0.0 /100 | #325 | Tragic $45,446 |
| Immigrants | Haiti | 0.0 /100 | #326 | Tragic $45,266 |
| Immigrants | Bahamas | 0.0 /100 | #327 | Tragic $45,176 |