Bermudan vs Immigrants from Europe Median Male Earnings
COMPARE
Bermudan
Immigrants from Europe
Median Male Earnings
Median Male Earnings Comparison
Bermudans
Immigrants from Europe
$52,465
MEDIAN MALE EARNINGS
12.1/ 100
METRIC RATING
209th/ 347
METRIC RANK
$62,057
MEDIAN MALE EARNINGS
99.9/ 100
METRIC RATING
49th/ 347
METRIC RANK
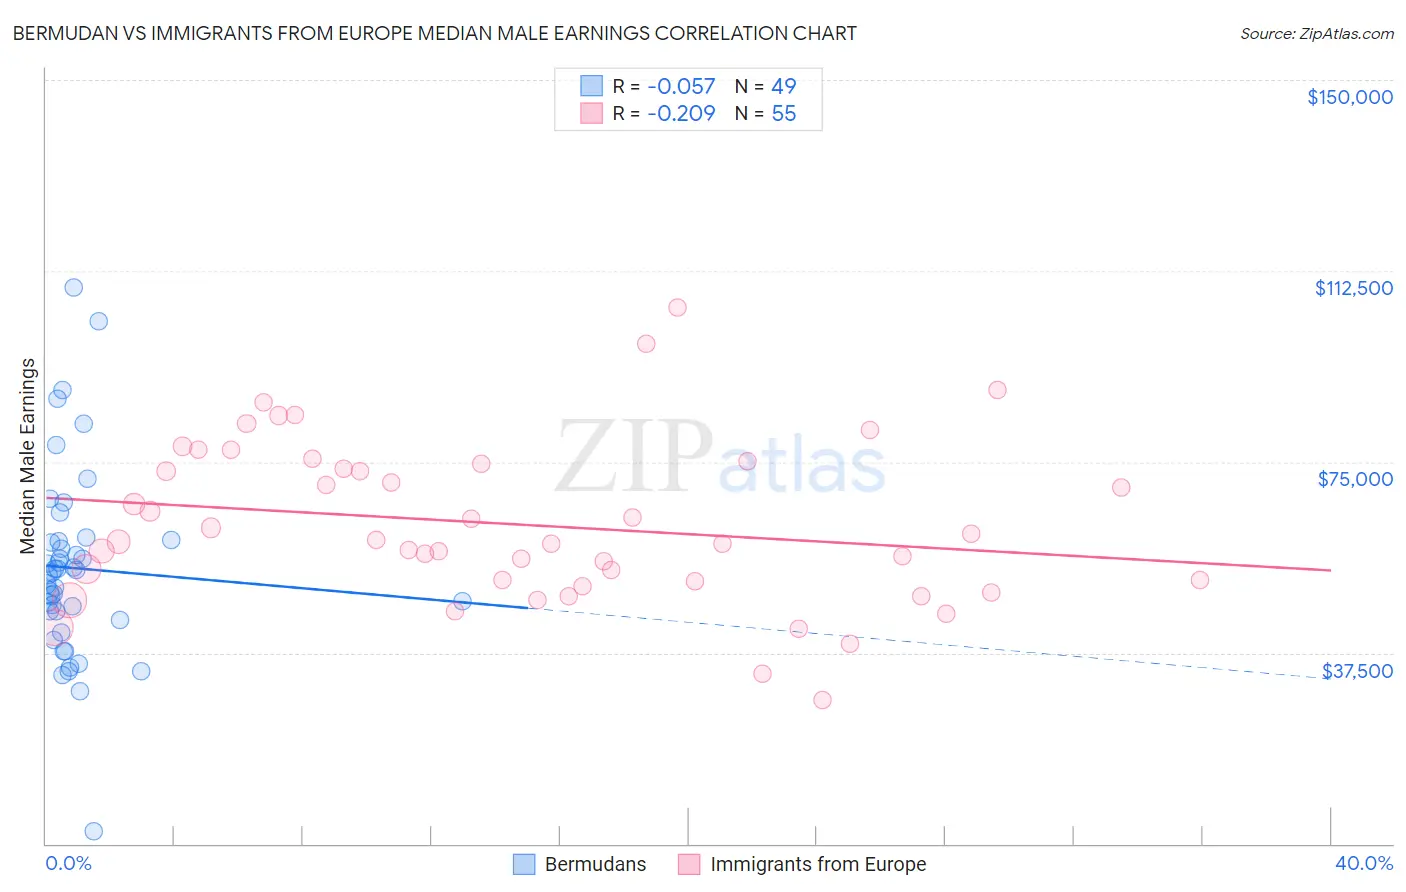
Bermudan vs Immigrants from Europe Median Male Earnings Correlation Chart
The statistical analysis conducted on geographies consisting of 55,727,224 people shows a slight negative correlation between the proportion of Bermudans and median male earnings in the United States with a correlation coefficient (R) of -0.057 and weighted average of $52,465. Similarly, the statistical analysis conducted on geographies consisting of 546,673,847 people shows a weak negative correlation between the proportion of Immigrants from Europe and median male earnings in the United States with a correlation coefficient (R) of -0.209 and weighted average of $62,057, a difference of 18.3%.
Median Male Earnings Correlation Summary
| Measurement | Bermudan | Immigrants from Europe |
| Minimum | $2,499 | $28,125 |
| Maximum | $109,250 | $105,302 |
| Range | $106,751 | $77,177 |
| Mean | $54,094 | $62,740 |
| Median | $53,290 | $59,324 |
| Interquartile 25% (IQ1) | $44,820 | $51,620 |
| Interquartile 75% (IQ3) | $59,519 | $74,675 |
| Interquartile Range (IQR) | $14,700 | $23,055 |
| Standard Deviation (Sample) | $18,662 | $15,923 |
| Standard Deviation (Population) | $18,471 | $15,777 |
Similar Demographics by Median Male Earnings
Demographics Similar to Bermudans by Median Male Earnings
In terms of median male earnings, the demographic groups most similar to Bermudans are Venezuelan ($52,510, a difference of 0.090%), Delaware ($52,412, a difference of 0.10%), Vietnamese ($52,525, a difference of 0.11%), Tlingit-Haida ($52,409, a difference of 0.11%), and Cajun ($52,325, a difference of 0.27%).
| Demographics | Rating | Rank | Median Male Earnings |
| Immigrants | Uruguay | 16.8 /100 | #202 | Poor $52,860 |
| Panamanians | 16.5 /100 | #203 | Poor $52,835 |
| Ghanaians | 16.1 /100 | #204 | Poor $52,810 |
| Immigrants | Colombia | 15.0 /100 | #205 | Poor $52,725 |
| Immigrants | Iraq | 14.5 /100 | #206 | Poor $52,681 |
| Vietnamese | 12.7 /100 | #207 | Poor $52,525 |
| Venezuelans | 12.5 /100 | #208 | Poor $52,510 |
| Bermudans | 12.1 /100 | #209 | Poor $52,465 |
| Delaware | 11.5 /100 | #210 | Poor $52,412 |
| Tlingit-Haida | 11.5 /100 | #211 | Poor $52,409 |
| Cajuns | 10.7 /100 | #212 | Poor $52,325 |
| Native Hawaiians | 10.5 /100 | #213 | Poor $52,306 |
| Immigrants | Nonimmigrants | 9.3 /100 | #214 | Tragic $52,170 |
| Immigrants | Cameroon | 8.9 /100 | #215 | Tragic $52,119 |
| Immigrants | Venezuela | 8.3 /100 | #216 | Tragic $52,041 |
Demographics Similar to Immigrants from Europe by Median Male Earnings
In terms of median male earnings, the demographic groups most similar to Immigrants from Europe are Immigrants from Malaysia ($62,121, a difference of 0.10%), Immigrants from Austria ($62,164, a difference of 0.17%), Immigrants from Czechoslovakia ($62,217, a difference of 0.26%), Bhutanese ($61,759, a difference of 0.48%), and Bulgarian ($62,378, a difference of 0.52%).
| Demographics | Rating | Rank | Median Male Earnings |
| Immigrants | Greece | 100.0 /100 | #42 | Exceptional $62,689 |
| Immigrants | Belarus | 100.0 /100 | #43 | Exceptional $62,658 |
| Cambodians | 100.0 /100 | #44 | Exceptional $62,516 |
| Bulgarians | 100.0 /100 | #45 | Exceptional $62,378 |
| Immigrants | Czechoslovakia | 99.9 /100 | #46 | Exceptional $62,217 |
| Immigrants | Austria | 99.9 /100 | #47 | Exceptional $62,164 |
| Immigrants | Malaysia | 99.9 /100 | #48 | Exceptional $62,121 |
| Immigrants | Europe | 99.9 /100 | #49 | Exceptional $62,057 |
| Bhutanese | 99.9 /100 | #50 | Exceptional $61,759 |
| Estonians | 99.9 /100 | #51 | Exceptional $61,710 |
| Immigrants | Norway | 99.9 /100 | #52 | Exceptional $61,628 |
| South Africans | 99.9 /100 | #53 | Exceptional $61,460 |
| Immigrants | Latvia | 99.9 /100 | #54 | Exceptional $61,422 |
| Greeks | 99.9 /100 | #55 | Exceptional $61,242 |
| Lithuanians | 99.9 /100 | #56 | Exceptional $61,228 |