Bermudan vs Venezuelan Doctorate Degree
COMPARE
Bermudan
Venezuelan
Doctorate Degree
Doctorate Degree Comparison
Bermudans
Venezuelans
1.8%
DOCTORATE DEGREE
52.1/ 100
METRIC RATING
171st/ 347
METRIC RANK
1.7%
DOCTORATE DEGREE
19.5/ 100
METRIC RATING
205th/ 347
METRIC RANK
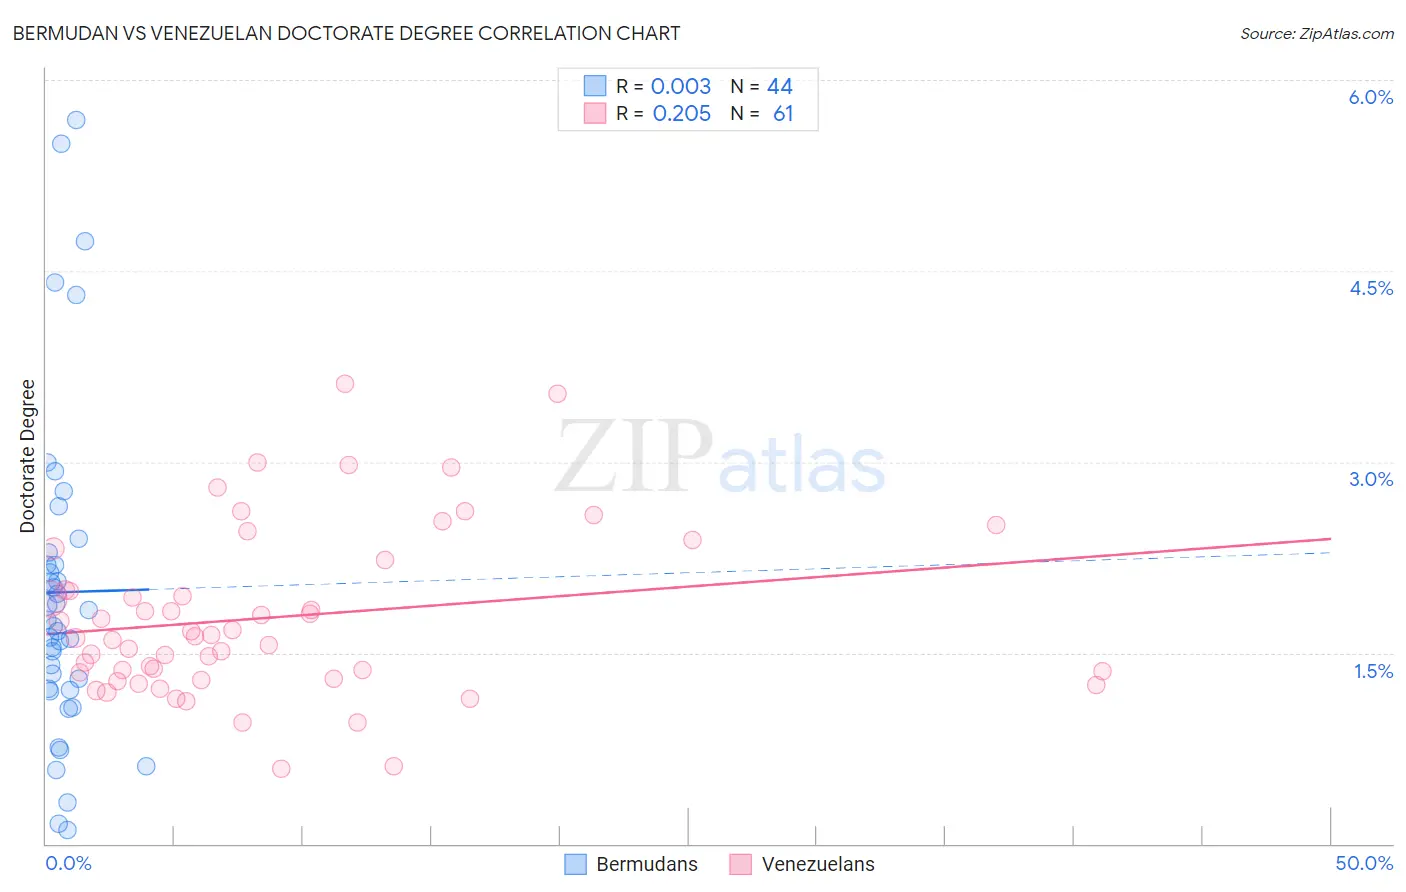
Bermudan vs Venezuelan Doctorate Degree Correlation Chart
The statistical analysis conducted on geographies consisting of 55,683,142 people shows no correlation between the proportion of Bermudans and percentage of population with at least doctorate degree education in the United States with a correlation coefficient (R) of 0.003 and weighted average of 1.8%. Similarly, the statistical analysis conducted on geographies consisting of 304,663,259 people shows a weak positive correlation between the proportion of Venezuelans and percentage of population with at least doctorate degree education in the United States with a correlation coefficient (R) of 0.205 and weighted average of 1.7%, a difference of 5.8%.
Doctorate Degree Correlation Summary
| Measurement | Bermudan | Venezuelan |
| Minimum | 0.10% | 0.59% |
| Maximum | 5.7% | 3.6% |
| Range | 5.6% | 3.0% |
| Mean | 2.0% | 1.8% |
| Median | 1.7% | 1.6% |
| Interquartile 25% (IQ1) | 1.2% | 1.3% |
| Interquartile 75% (IQ3) | 2.2% | 2.1% |
| Interquartile Range (IQR) | 1.0% | 0.78% |
| Standard Deviation (Sample) | 1.3% | 0.66% |
| Standard Deviation (Population) | 1.3% | 0.65% |
Similar Demographics by Doctorate Degree
Demographics Similar to Bermudans by Doctorate Degree
In terms of doctorate degree, the demographic groups most similar to Bermudans are Costa Rican (1.8%, a difference of 0.17%), Belgian (1.8%, a difference of 0.27%), Norwegian (1.8%, a difference of 0.31%), Immigrants from Bangladesh (1.8%, a difference of 0.31%), and Vietnamese (1.9%, a difference of 0.39%).
| Demographics | Rating | Rank | Doctorate Degree |
| Celtics | 66.7 /100 | #164 | Good 1.9% |
| Scotch-Irish | 63.6 /100 | #165 | Good 1.9% |
| Spaniards | 63.5 /100 | #166 | Good 1.9% |
| Macedonians | 60.9 /100 | #167 | Good 1.9% |
| Sri Lankans | 60.3 /100 | #168 | Good 1.9% |
| Vietnamese | 54.8 /100 | #169 | Average 1.9% |
| Costa Ricans | 53.3 /100 | #170 | Average 1.8% |
| Bermudans | 52.1 /100 | #171 | Average 1.8% |
| Belgians | 50.3 /100 | #172 | Average 1.8% |
| Norwegians | 50.0 /100 | #173 | Average 1.8% |
| Immigrants | Bangladesh | 50.0 /100 | #174 | Average 1.8% |
| Immigrants | Thailand | 49.4 /100 | #175 | Average 1.8% |
| Spanish | 49.3 /100 | #176 | Average 1.8% |
| Iraqis | 49.2 /100 | #177 | Average 1.8% |
| French | 48.8 /100 | #178 | Average 1.8% |
Demographics Similar to Venezuelans by Doctorate Degree
In terms of doctorate degree, the demographic groups most similar to Venezuelans are Somali (1.7%, a difference of 0.41%), Immigrants from Vietnam (1.8%, a difference of 0.44%), Portuguese (1.8%, a difference of 0.46%), Immigrants from Peru (1.7%, a difference of 0.48%), and Yugoslavian (1.7%, a difference of 0.64%).
| Demographics | Rating | Rank | Doctorate Degree |
| Immigrants | Ghana | 24.6 /100 | #198 | Fair 1.8% |
| Immigrants | South America | 23.3 /100 | #199 | Fair 1.8% |
| Whites/Caucasians | 22.8 /100 | #200 | Fair 1.8% |
| Immigrants | Nigeria | 22.4 /100 | #201 | Fair 1.8% |
| Portuguese | 21.4 /100 | #202 | Fair 1.8% |
| Immigrants | Vietnam | 21.4 /100 | #203 | Fair 1.8% |
| Somalis | 21.2 /100 | #204 | Fair 1.7% |
| Venezuelans | 19.5 /100 | #205 | Poor 1.7% |
| Immigrants | Peru | 17.6 /100 | #206 | Poor 1.7% |
| Yugoslavians | 17.1 /100 | #207 | Poor 1.7% |
| Colombians | 16.1 /100 | #208 | Poor 1.7% |
| Immigrants | Western Africa | 15.4 /100 | #209 | Poor 1.7% |
| Tongans | 15.1 /100 | #210 | Poor 1.7% |
| Immigrants | Armenia | 15.1 /100 | #211 | Poor 1.7% |
| Immigrants | South Eastern Asia | 14.7 /100 | #212 | Poor 1.7% |