Immigrants from Colombia vs Pennsylvania German Per Capita Income
COMPARE
Immigrants from Colombia
Pennsylvania German
Per Capita Income
Per Capita Income Comparison
Immigrants from Colombia
Pennsylvania Germans
$42,971
PER CAPITA INCOME
31.5/ 100
METRIC RATING
187th/ 347
METRIC RANK
$37,842
PER CAPITA INCOME
0.1/ 100
METRIC RATING
283rd/ 347
METRIC RANK
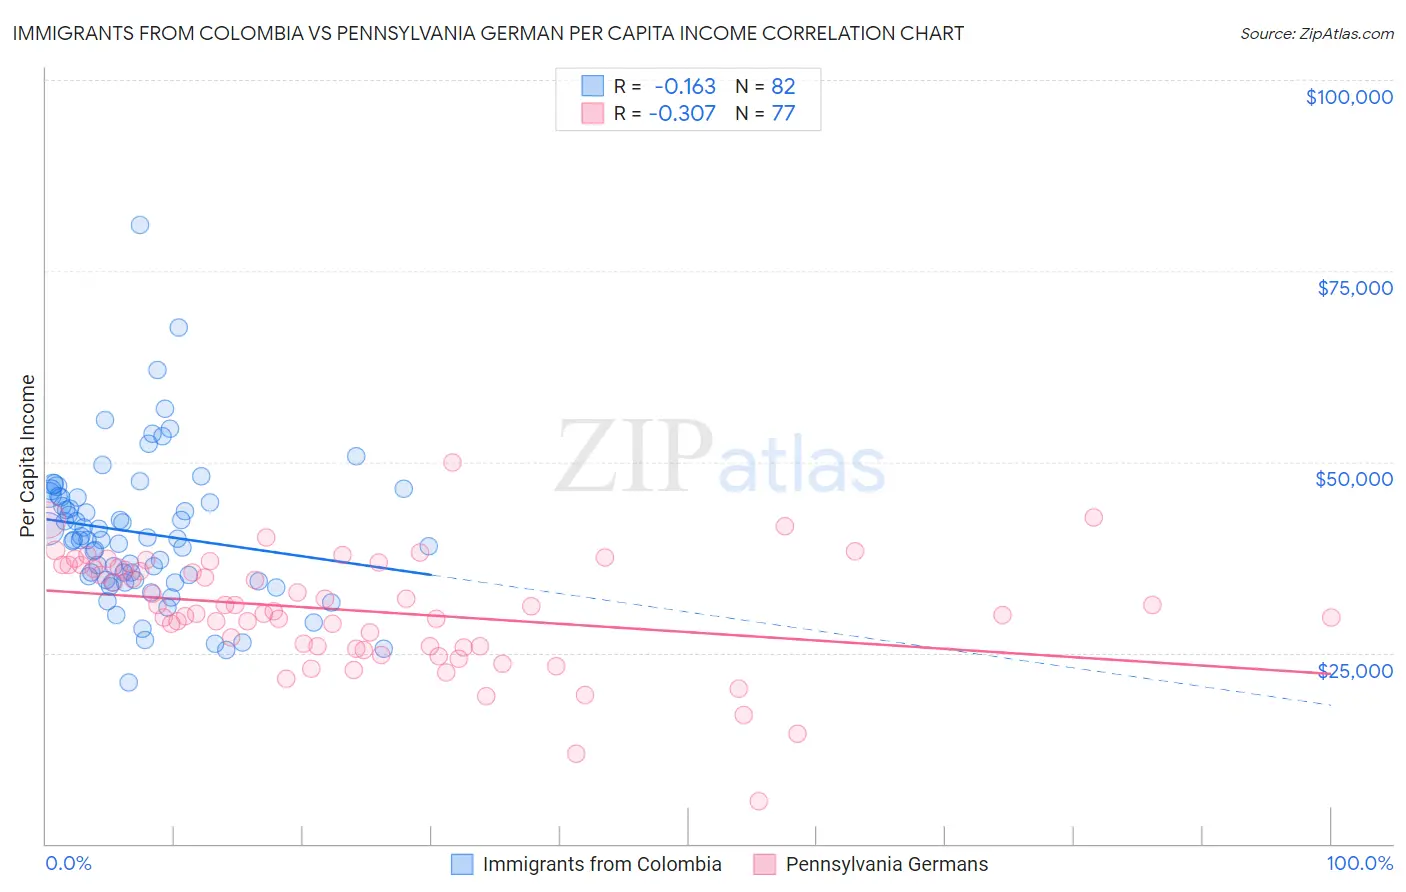
Immigrants from Colombia vs Pennsylvania German Per Capita Income Correlation Chart
The statistical analysis conducted on geographies consisting of 378,698,677 people shows a poor negative correlation between the proportion of Immigrants from Colombia and per capita income in the United States with a correlation coefficient (R) of -0.163 and weighted average of $42,971. Similarly, the statistical analysis conducted on geographies consisting of 234,109,606 people shows a mild negative correlation between the proportion of Pennsylvania Germans and per capita income in the United States with a correlation coefficient (R) of -0.307 and weighted average of $37,842, a difference of 13.6%.
Per Capita Income Correlation Summary
| Measurement | Immigrants from Colombia | Pennsylvania German |
| Minimum | $21,139 | $5,500 |
| Maximum | $80,934 | $49,889 |
| Range | $59,795 | $44,389 |
| Mean | $40,659 | $30,450 |
| Median | $39,822 | $30,408 |
| Interquartile 25% (IQ1) | $34,523 | $25,731 |
| Interquartile 75% (IQ3) | $45,376 | $36,297 |
| Interquartile Range (IQR) | $10,853 | $10,566 |
| Standard Deviation (Sample) | $9,573 | $7,465 |
| Standard Deviation (Population) | $9,515 | $7,416 |
Similar Demographics by Per Capita Income
Demographics Similar to Immigrants from Colombia by Per Capita Income
In terms of per capita income, the demographic groups most similar to Immigrants from Colombia are Immigrants from Africa ($42,950, a difference of 0.050%), French Canadian ($43,003, a difference of 0.070%), Immigrants ($43,010, a difference of 0.090%), Spaniard ($43,028, a difference of 0.13%), and Bermudan ($42,911, a difference of 0.14%).
| Demographics | Rating | Rank | Per Capita Income |
| Sierra Leoneans | 42.9 /100 | #180 | Average $43,405 |
| Welsh | 38.2 /100 | #181 | Fair $43,233 |
| Immigrants | Vietnam | 38.1 /100 | #182 | Fair $43,229 |
| Germans | 33.9 /100 | #183 | Fair $43,067 |
| Spaniards | 32.9 /100 | #184 | Fair $43,028 |
| Immigrants | Immigrants | 32.5 /100 | #185 | Fair $43,010 |
| French Canadians | 32.3 /100 | #186 | Fair $43,003 |
| Immigrants | Colombia | 31.5 /100 | #187 | Fair $42,971 |
| Immigrants | Africa | 31.0 /100 | #188 | Fair $42,950 |
| Bermudans | 30.1 /100 | #189 | Fair $42,911 |
| Kenyans | 27.7 /100 | #190 | Fair $42,808 |
| Yugoslavians | 27.4 /100 | #191 | Fair $42,792 |
| Iraqis | 26.7 /100 | #192 | Fair $42,760 |
| Immigrants | Sierra Leone | 26.5 /100 | #193 | Fair $42,752 |
| Immigrants | Fiji | 25.2 /100 | #194 | Fair $42,694 |
Demographics Similar to Pennsylvania Germans by Per Capita Income
In terms of per capita income, the demographic groups most similar to Pennsylvania Germans are Immigrants from Laos ($37,857, a difference of 0.040%), African ($37,785, a difference of 0.15%), Guatemalan ($37,766, a difference of 0.20%), Immigrants from Dominica ($37,952, a difference of 0.29%), and Central American Indian ($37,699, a difference of 0.38%).
| Demographics | Rating | Rank | Per Capita Income |
| Hmong | 0.2 /100 | #276 | Tragic $38,120 |
| Comanche | 0.2 /100 | #277 | Tragic $38,088 |
| Immigrants | Nicaragua | 0.2 /100 | #278 | Tragic $38,065 |
| Colville | 0.2 /100 | #279 | Tragic $38,047 |
| Potawatomi | 0.2 /100 | #280 | Tragic $38,046 |
| Immigrants | Dominica | 0.2 /100 | #281 | Tragic $37,952 |
| Immigrants | Laos | 0.1 /100 | #282 | Tragic $37,857 |
| Pennsylvania Germans | 0.1 /100 | #283 | Tragic $37,842 |
| Africans | 0.1 /100 | #284 | Tragic $37,785 |
| Guatemalans | 0.1 /100 | #285 | Tragic $37,766 |
| Central American Indians | 0.1 /100 | #286 | Tragic $37,699 |
| Dominicans | 0.1 /100 | #287 | Tragic $37,697 |
| Blackfeet | 0.1 /100 | #288 | Tragic $37,695 |
| U.S. Virgin Islanders | 0.1 /100 | #289 | Tragic $37,589 |
| Immigrants | Guatemala | 0.1 /100 | #290 | Tragic $37,550 |