Immigrants from Western Asia vs Pennsylvania German Per Capita Income
COMPARE
Immigrants from Western Asia
Pennsylvania German
Per Capita Income
Per Capita Income Comparison
Immigrants from Western Asia
Pennsylvania Germans
$46,876
PER CAPITA INCOME
97.4/ 100
METRIC RATING
102nd/ 347
METRIC RANK
$37,842
PER CAPITA INCOME
0.1/ 100
METRIC RATING
283rd/ 347
METRIC RANK
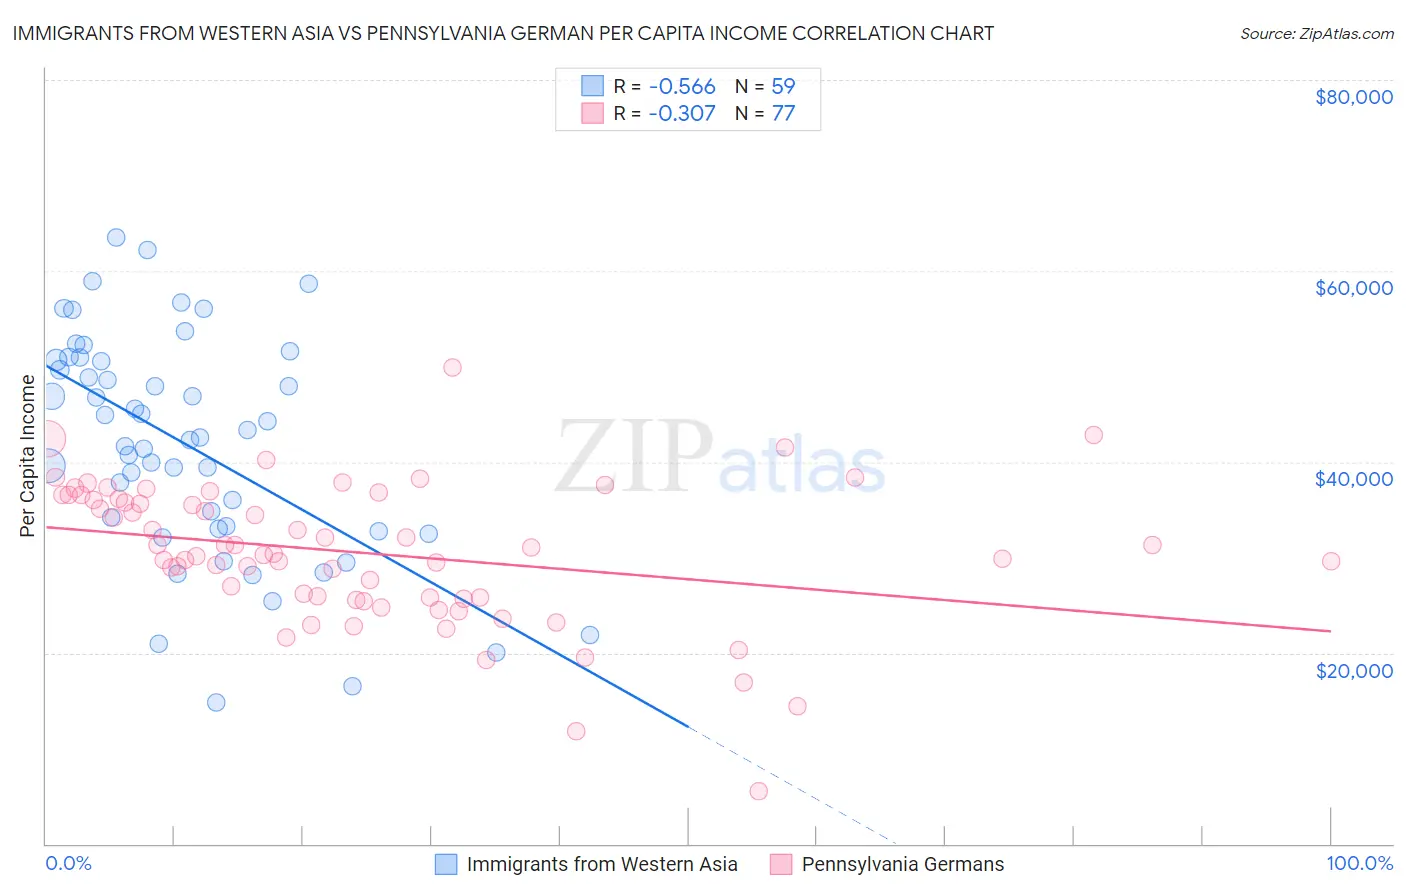
Immigrants from Western Asia vs Pennsylvania German Per Capita Income Correlation Chart
The statistical analysis conducted on geographies consisting of 404,456,113 people shows a substantial negative correlation between the proportion of Immigrants from Western Asia and per capita income in the United States with a correlation coefficient (R) of -0.566 and weighted average of $46,876. Similarly, the statistical analysis conducted on geographies consisting of 234,109,606 people shows a mild negative correlation between the proportion of Pennsylvania Germans and per capita income in the United States with a correlation coefficient (R) of -0.307 and weighted average of $37,842, a difference of 23.9%.
Per Capita Income Correlation Summary
| Measurement | Immigrants from Western Asia | Pennsylvania German |
| Minimum | $14,820 | $5,500 |
| Maximum | $63,449 | $49,889 |
| Range | $48,629 | $44,389 |
| Mean | $41,748 | $30,450 |
| Median | $42,571 | $30,408 |
| Interquartile 25% (IQ1) | $33,011 | $25,731 |
| Interquartile 75% (IQ3) | $50,679 | $36,297 |
| Interquartile Range (IQR) | $17,668 | $10,566 |
| Standard Deviation (Sample) | $11,611 | $7,465 |
| Standard Deviation (Population) | $11,513 | $7,416 |
Similar Demographics by Per Capita Income
Demographics Similar to Immigrants from Western Asia by Per Capita Income
In terms of per capita income, the demographic groups most similar to Immigrants from Western Asia are Syrian ($46,837, a difference of 0.080%), Immigrants from Uzbekistan ($46,929, a difference of 0.11%), Immigrants from Lebanon ($46,938, a difference of 0.13%), Laotian ($47,041, a difference of 0.35%), and Brazilian ($46,700, a difference of 0.38%).
| Demographics | Rating | Rank | Per Capita Income |
| Immigrants | Egypt | 98.5 /100 | #95 | Exceptional $47,361 |
| Alsatians | 98.3 /100 | #96 | Exceptional $47,284 |
| Carpatho Rusyns | 98.2 /100 | #97 | Exceptional $47,248 |
| Immigrants | Pakistan | 97.9 /100 | #98 | Exceptional $47,084 |
| Laotians | 97.8 /100 | #99 | Exceptional $47,041 |
| Immigrants | Lebanon | 97.5 /100 | #100 | Exceptional $46,938 |
| Immigrants | Uzbekistan | 97.5 /100 | #101 | Exceptional $46,929 |
| Immigrants | Western Asia | 97.4 /100 | #102 | Exceptional $46,876 |
| Syrians | 97.2 /100 | #103 | Exceptional $46,837 |
| Brazilians | 96.8 /100 | #104 | Exceptional $46,700 |
| British | 96.3 /100 | #105 | Exceptional $46,571 |
| Ethiopians | 96.3 /100 | #106 | Exceptional $46,569 |
| Serbians | 96.2 /100 | #107 | Exceptional $46,551 |
| Immigrants | Kuwait | 96.2 /100 | #108 | Exceptional $46,543 |
| Immigrants | Northern Africa | 96.2 /100 | #109 | Exceptional $46,531 |
Demographics Similar to Pennsylvania Germans by Per Capita Income
In terms of per capita income, the demographic groups most similar to Pennsylvania Germans are Immigrants from Laos ($37,857, a difference of 0.040%), African ($37,785, a difference of 0.15%), Guatemalan ($37,766, a difference of 0.20%), Immigrants from Dominica ($37,952, a difference of 0.29%), and Central American Indian ($37,699, a difference of 0.38%).
| Demographics | Rating | Rank | Per Capita Income |
| Hmong | 0.2 /100 | #276 | Tragic $38,120 |
| Comanche | 0.2 /100 | #277 | Tragic $38,088 |
| Immigrants | Nicaragua | 0.2 /100 | #278 | Tragic $38,065 |
| Colville | 0.2 /100 | #279 | Tragic $38,047 |
| Potawatomi | 0.2 /100 | #280 | Tragic $38,046 |
| Immigrants | Dominica | 0.2 /100 | #281 | Tragic $37,952 |
| Immigrants | Laos | 0.1 /100 | #282 | Tragic $37,857 |
| Pennsylvania Germans | 0.1 /100 | #283 | Tragic $37,842 |
| Africans | 0.1 /100 | #284 | Tragic $37,785 |
| Guatemalans | 0.1 /100 | #285 | Tragic $37,766 |
| Central American Indians | 0.1 /100 | #286 | Tragic $37,699 |
| Dominicans | 0.1 /100 | #287 | Tragic $37,697 |
| Blackfeet | 0.1 /100 | #288 | Tragic $37,695 |
| U.S. Virgin Islanders | 0.1 /100 | #289 | Tragic $37,589 |
| Immigrants | Guatemala | 0.1 /100 | #290 | Tragic $37,550 |