Belgian vs Mongolian Receiving Food Stamps
COMPARE
Belgian
Mongolian
Receiving Food Stamps
Receiving Food Stamps Comparison
Belgians
Mongolians
10.2%
RECEIVING FOOD STAMPS
97.7/ 100
METRIC RATING
93rd/ 347
METRIC RANK
10.5%
RECEIVING FOOD STAMPS
95.8/ 100
METRIC RATING
112th/ 347
METRIC RANK
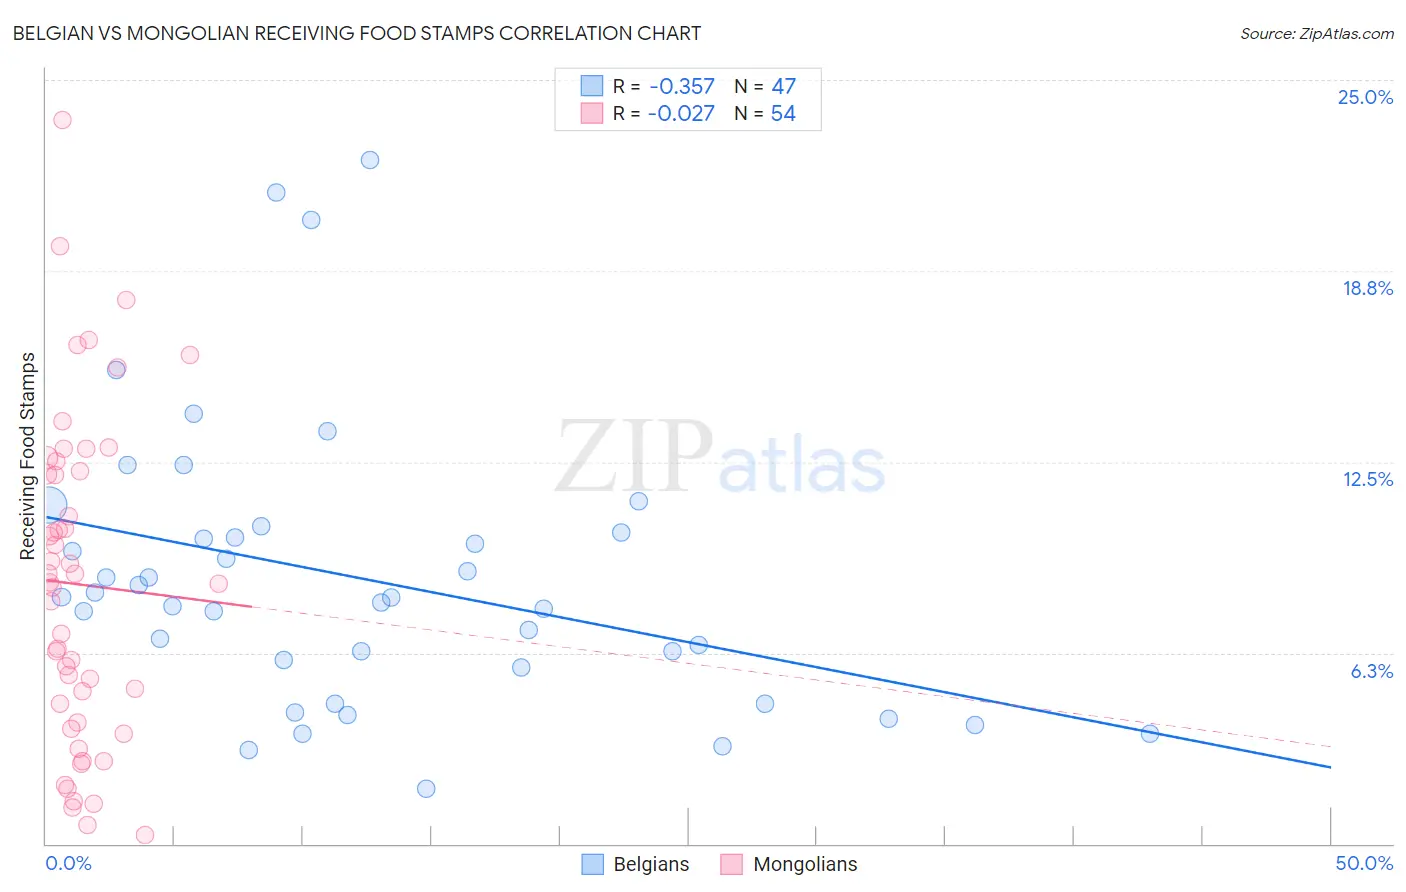
Belgian vs Mongolian Receiving Food Stamps Correlation Chart
The statistical analysis conducted on geographies consisting of 355,046,721 people shows a mild negative correlation between the proportion of Belgians and percentage of population receiving government assistance and/or food stamps in the United States with a correlation coefficient (R) of -0.357 and weighted average of 10.2%. Similarly, the statistical analysis conducted on geographies consisting of 140,177,644 people shows no correlation between the proportion of Mongolians and percentage of population receiving government assistance and/or food stamps in the United States with a correlation coefficient (R) of -0.027 and weighted average of 10.5%, a difference of 2.5%.
Receiving Food Stamps Correlation Summary
| Measurement | Belgian | Mongolian |
| Minimum | 1.8% | 0.30% |
| Maximum | 22.4% | 23.7% |
| Range | 20.6% | 23.4% |
| Mean | 8.7% | 8.5% |
| Median | 8.1% | 8.5% |
| Interquartile 25% (IQ1) | 5.8% | 4.0% |
| Interquartile 75% (IQ3) | 10.2% | 12.2% |
| Interquartile Range (IQR) | 4.4% | 8.2% |
| Standard Deviation (Sample) | 4.6% | 5.3% |
| Standard Deviation (Population) | 4.5% | 5.3% |
Demographics Similar to Belgians and Mongolians by Receiving Food Stamps
In terms of receiving food stamps, the demographic groups most similar to Belgians are Irish (10.2%, a difference of 0.38%), Immigrants from Greece (10.3%, a difference of 0.53%), Basque (10.3%, a difference of 0.55%), Welsh (10.3%, a difference of 0.61%), and Czechoslovakian (10.3%, a difference of 0.86%). Similarly, the demographic groups most similar to Mongolians are Romanian (10.4%, a difference of 0.010%), Pakistani (10.4%, a difference of 0.11%), Immigrants from Pakistan (10.4%, a difference of 0.39%), Carpatho Rusyn (10.4%, a difference of 0.44%), and Korean (10.4%, a difference of 0.47%).
| Demographics | Rating | Rank | Receiving Food Stamps |
| Irish | 97.9 /100 | #92 | Exceptional 10.2% |
| Belgians | 97.7 /100 | #93 | Exceptional 10.2% |
| Immigrants | Greece | 97.4 /100 | #94 | Exceptional 10.3% |
| Basques | 97.4 /100 | #95 | Exceptional 10.3% |
| Welsh | 97.3 /100 | #96 | Exceptional 10.3% |
| Czechoslovakians | 97.2 /100 | #97 | Exceptional 10.3% |
| Immigrants | Egypt | 97.1 /100 | #98 | Exceptional 10.3% |
| Serbians | 97.0 /100 | #99 | Exceptional 10.3% |
| Immigrants | Western Europe | 96.9 /100 | #100 | Exceptional 10.3% |
| Palestinians | 96.9 /100 | #101 | Exceptional 10.3% |
| Immigrants | Europe | 96.8 /100 | #102 | Exceptional 10.3% |
| Immigrants | Latvia | 96.8 /100 | #103 | Exceptional 10.3% |
| Immigrants | Hungary | 96.7 /100 | #104 | Exceptional 10.3% |
| Immigrants | Malaysia | 96.5 /100 | #105 | Exceptional 10.4% |
| Immigrants | Italy | 96.4 /100 | #106 | Exceptional 10.4% |
| Koreans | 96.3 /100 | #107 | Exceptional 10.4% |
| Carpatho Rusyns | 96.2 /100 | #108 | Exceptional 10.4% |
| Immigrants | Pakistan | 96.2 /100 | #109 | Exceptional 10.4% |
| Pakistanis | 95.9 /100 | #110 | Exceptional 10.4% |
| Romanians | 95.8 /100 | #111 | Exceptional 10.4% |
| Mongolians | 95.8 /100 | #112 | Exceptional 10.5% |