Belgian vs Mongolian Householder Income Ages 45 - 64 years

COMPARE

Belgian
Race
Ancestry
AfghanAfricanAlaska NativeAlaskan AthabascanAlbanianAleutAlsatianAmericanApacheArabArapahoArgentineanArmenianAssyrian/Chaldean/SyriacAustralianAustrianBahamianBangladeshiBarbadianBasqueBelgianBelizeanBermudanBhutaneseBlackfeetBolivianBrazilianBritishBritish West IndianBulgarianBurmeseCajunCambodianCanadianCape VerdeanCarpatho RusynCelticCentral AmericanCentral American IndianCherokeeCheyenneChickasawChileanChineseChippewaChoctawColombianColvilleComancheCosta RicanCreeCreekCroatianCrowCubanCypriotCzechCzechoslovakianDanishDelawareDominicanDutchDutch West IndianEastern EuropeanEcuadorianEgyptianEnglishEstonianEthiopianEuropeanFijianFilipinoFinnishFrenchFrench American IndianFrench CanadianGermanGerman RussianGhanaianGreekGuamanian/ChamorroGuatemalanGuyaneseHaitianHmongHonduranHopiHoumaHungarianIcelanderIndian (Asian)IndonesianInupiatIranianIraqiIrishIroquoisIsraeliItalianJamaicanJapaneseJordanianKenyanKiowaKoreanLaotianLatvianLebaneseLiberianLithuanianLumbeeLuxembourgerMacedonianMalaysianMalteseMarshalleseMenomineeMexicanMexican American IndianMoroccanNative HawaiianNavajoNepaleseNew ZealanderNicaraguanNigerianNorthern EuropeanNorwegianOkinawanOsageOttawaPaiutePakistaniPalestinianPanamanianParaguayanPennsylvania GermanPeruvianPimaPolishPortuguesePotawatomiPuebloPuerto RicanPuget Sound SalishRomanianRussianSalvadoranSamoanScandinavianScotch-IrishScottishSeminoleSenegaleseSerbianShoshoneSierra LeoneanSiouxSlavicSlovakSloveneSomaliSouth AfricanSouth AmericanSouth American IndianSoviet UnionSpaniardSpanishSpanish AmericanSpanish American IndianSri LankanSubsaharan AfricanSudaneseSwedishSwissSyrianTaiwaneseThaiTlingit-HaidaTohono O'OdhamTonganTrinidadian and TobagonianTsimshianTurkishU.S. Virgin IslanderUgandanUkrainianUruguayanUteVenezuelanVietnameseWelshWest IndianYakamaYaquiYugoslavianYumanYup'ikZimbabwean
Immigration
NonimmigrantsImmigrantsAfghanistanAfricaAlbaniaArgentinaArmeniaAsiaAustraliaAustriaBahamasBangladeshBarbadosBelarusBelgiumBelizeBoliviaBosnia and HerzegovinaBrazilBulgariaBurma/MyanmarCabo VerdeCambodiaCameroonCanadaCaribbeanCentral AmericaChileChinaColombiaCongoCosta RicaCroatiaCubaCzechoslovakiaDenmarkDominicaDominican RepublicEastern AfricaEastern AsiaEastern EuropeEcuadorEgyptEl SalvadorEnglandEritreaEthiopiaEuropeFijiFranceGermanyGhanaGreeceGrenadaGuatemalaGuyanaHaitiHondurasHong KongHungaryIndiaIndonesiaIranIraqIrelandIsraelItalyJamaicaJapanJordanKazakhstanKenyaKoreaKuwaitLaosLatin AmericaLatviaLebanonLiberiaLithuaniaMalaysiaMexicoMicronesiaMiddle AfricaMoldovaMoroccoNepalNetherlandsNicaraguaNigeriaNorth AmericaNorth MacedoniaNorthern AfricaNorthern EuropeNorwayOceaniaPakistanPanamaPeruPhilippinesPolandPortugalRomaniaRussiaSaudi ArabiaScotlandSenegalSerbiaSierra LeoneSingaporeSomaliaSouth AfricaSouth AmericaSouth Central AsiaSouth Eastern AsiaSouthern EuropeSpainSri LankaSt. Vincent and the GrenadinesSudanSwedenSwitzerlandSyriaTaiwanThailandTrinidad and TobagoTurkeyUgandaUkraineUruguayUzbekistanVenezuelaVietnamWest IndiesWestern AfricaWestern AsiaWestern EuropeYemenZaireZimbabweAzores
Mongolian
Race
Ancestry
AfghanAfricanAlaska NativeAlaskan AthabascanAlbanianAleutAlsatianAmericanApacheArabArapahoArgentineanArmenianAssyrian/Chaldean/SyriacAustralianAustrianBahamianBangladeshiBarbadianBasqueBelizeanBermudanBhutaneseBlackfeetBolivianBrazilianBritishBritish West IndianBulgarianBurmeseCajunCambodianCanadianCape VerdeanCarpatho RusynCelticCentral AmericanCentral American IndianCherokeeCheyenneChickasawChileanChineseChippewaChoctawColombianColvilleComancheCosta RicanCreeCreekCroatianCrowCubanCypriotCzechCzechoslovakianDanishDelawareDominicanDutchDutch West IndianEastern EuropeanEcuadorianEgyptianEnglishEstonianEthiopianEuropeanFijianFilipinoFinnishFrenchFrench American IndianFrench CanadianGermanGerman RussianGhanaianGreekGuamanian/ChamorroGuatemalanGuyaneseHaitianHmongHonduranHopiHoumaHungarianIcelanderIndian (Asian)IndonesianInupiatIranianIraqiIrishIroquoisIsraeliItalianJamaicanJapaneseJordanianKenyanKiowaKoreanLaotianLatvianLebaneseLiberianLithuanianLumbeeLuxembourgerMacedonianMalaysianMalteseMarshalleseMenomineeMexicanMexican American IndianMongolianMoroccanNative HawaiianNavajoNepaleseNew ZealanderNicaraguanNigerianNorthern EuropeanNorwegianOkinawanOsageOttawaPaiutePakistaniPalestinianPanamanianParaguayanPennsylvania GermanPeruvianPimaPolishPortuguesePotawatomiPuebloPuerto RicanPuget Sound SalishRomanianRussianSalvadoranSamoanScandinavianScotch-IrishScottishSeminoleSenegaleseSerbianShoshoneSierra LeoneanSiouxSlavicSlovakSloveneSomaliSouth AfricanSouth AmericanSouth American IndianSoviet UnionSpaniardSpanishSpanish AmericanSpanish American IndianSri LankanSubsaharan AfricanSudaneseSwedishSwissSyrianTaiwaneseThaiTlingit-HaidaTohono O'OdhamTonganTrinidadian and TobagonianTsimshianTurkishU.S. Virgin IslanderUgandanUkrainianUruguayanUteVenezuelanVietnameseWelshWest IndianYakamaYaquiYugoslavianYumanYup'ikZimbabwean
Immigration
NonimmigrantsImmigrantsAfghanistanAfricaAlbaniaArgentinaArmeniaAsiaAustraliaAustriaBahamasBangladeshBarbadosBelarusBelgiumBelizeBoliviaBosnia and HerzegovinaBrazilBulgariaBurma/MyanmarCabo VerdeCambodiaCameroonCanadaCaribbeanCentral AmericaChileChinaColombiaCongoCosta RicaCroatiaCubaCzechoslovakiaDenmarkDominicaDominican RepublicEastern AfricaEastern AsiaEastern EuropeEcuadorEgyptEl SalvadorEnglandEritreaEthiopiaEuropeFijiFranceGermanyGhanaGreeceGrenadaGuatemalaGuyanaHaitiHondurasHong KongHungaryIndiaIndonesiaIranIraqIrelandIsraelItalyJamaicaJapanJordanKazakhstanKenyaKoreaKuwaitLaosLatin AmericaLatviaLebanonLiberiaLithuaniaMalaysiaMexicoMicronesiaMiddle AfricaMoldovaMoroccoNepalNetherlandsNicaraguaNigeriaNorth AmericaNorth MacedoniaNorthern AfricaNorthern EuropeNorwayOceaniaPakistanPanamaPeruPhilippinesPolandPortugalRomaniaRussiaSaudi ArabiaScotlandSenegalSerbiaSierra LeoneSingaporeSomaliaSouth AfricaSouth AmericaSouth Central AsiaSouth Eastern AsiaSouthern EuropeSpainSri LankaSt. Vincent and the GrenadinesSudanSwedenSwitzerlandSyriaTaiwanThailandTrinidad and TobagoTurkeyUgandaUkraineUruguayUzbekistanVenezuelaVietnamWest IndiesWestern AfricaWestern AsiaWestern EuropeYemenZaireZimbabweAzores
Householder Income Ages 45 - 64 years
Income
Poverty
Unemployment
Labor Participation
Family Structure
Vehicle Availability
Education Level
Disability

Householder Income Ages 45 - 64 years Comparison

Belgians

Mongolians

Average
Exceptional
$100,060
HOUSEHOLDER INCOME AGES 45 - 64 YEARS
46.7/ 100
METRIC RATING
179th/ 347
METRIC RANK
$111,602
HOUSEHOLDER INCOME AGES 45 - 64 YEARS
99.6/ 100
METRIC RATING
63rd/ 347
METRIC RANK

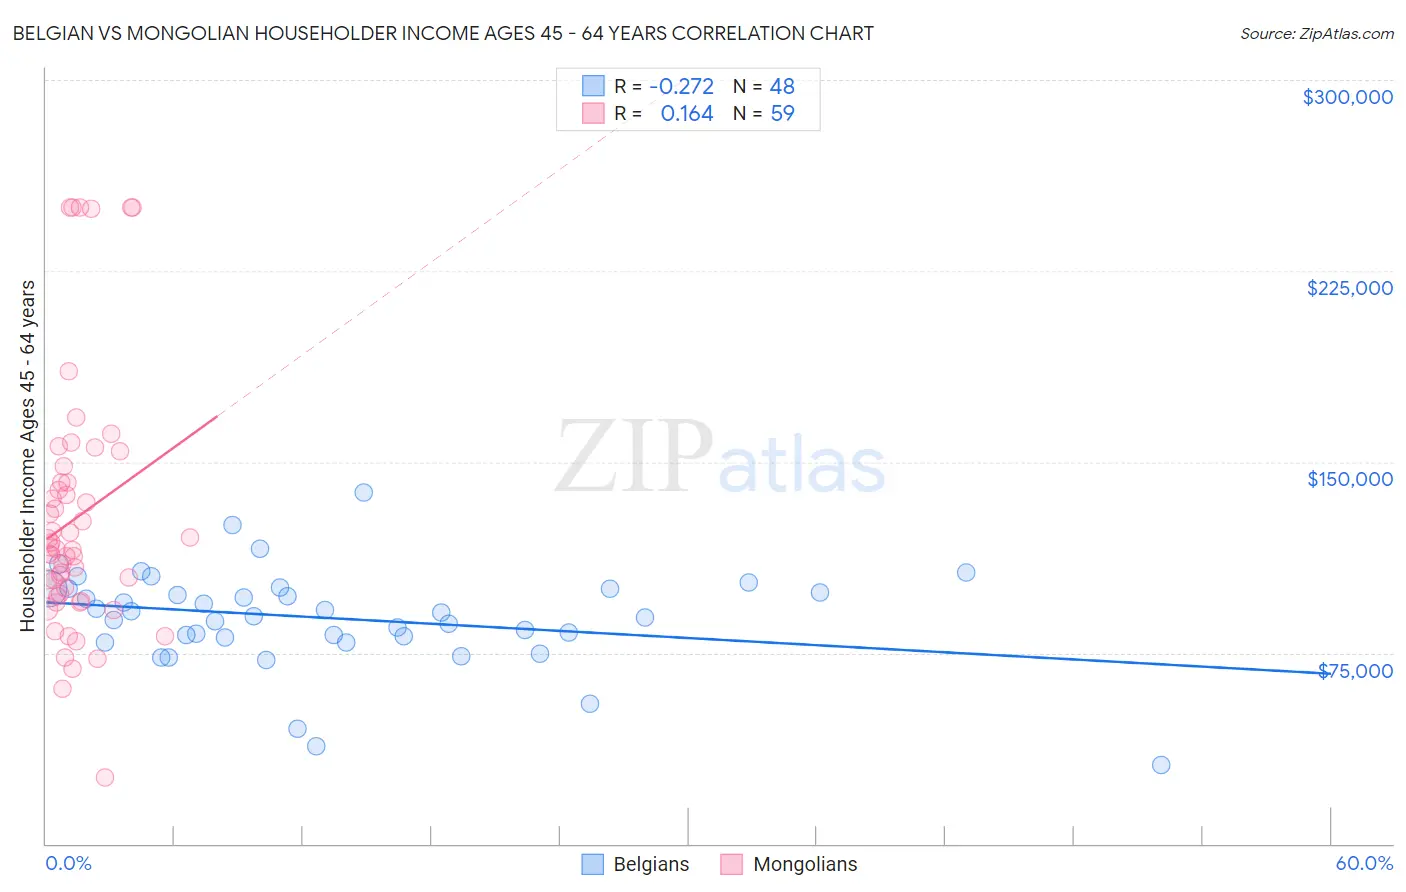
Belgian vs Mongolian Householder Income Ages 45 - 64 years Correlation Chart

The statistical analysis conducted on geographies consisting of 355,498,579 people shows a weak negative correlation between the proportion of Belgians and household income with householder between the ages 45 and 64 in the United States with a correlation coefficient (R) of -0.272 and weighted average of $100,060. Similarly, the statistical analysis conducted on geographies consisting of 140,216,470 people shows a poor positive correlation between the proportion of Mongolians and household income with householder between the ages 45 and 64 in the United States with a correlation coefficient (R) of 0.164 and weighted average of $111,602, a difference of 11.5%.
Belgian vs Mongolian Householder Income Ages 45 - 64 years

Householder Income Ages 45 - 64 years Correlation Summary

MeasurementBelgianMongolian
Minimum$30,833$25,952
Maximum$138,162$250,001
Range$107,329$224,049
Mean$88,608$127,849
Median$89,979$115,953
Interquartile 25% (IQ1)$81,216$97,273
Interquartile 75% (IQ3)$100,318$142,123
Interquartile Range (IQR)$19,101$44,850
Standard Deviation (Sample)$19,546$50,162
Standard Deviation (Population)$19,341$49,735

Similar Demographics by Householder Income Ages 45 - 64 years

Demographics Similar to Belgians by Householder Income Ages 45 - 64 years

In terms of householder income ages 45 - 64 years, the demographic groups most similar to Belgians are Aleut ($100,052, a difference of 0.010%), Immigrants from Cameroon ($100,084, a difference of 0.020%), Immigrants from Costa Rica ($100,141, a difference of 0.080%), Moroccan ($100,138, a difference of 0.080%), and Immigrants ($99,943, a difference of 0.12%).
DemographicsRating | RankHouseholder Income Ages 45 - 64 years
Immigrants | Uzbekistan
52.5
/100
|
#172
Average
$100,523
Alsatians
51.4
/100
|
#173
Average
$100,435
Welsh
50.0
/100
|
#174
Average
$100,322
Germans
48.8
/100
|
#175
Average
$100,224
Immigrants | Costa Rica
47.7
/100
|
#176
Average
$100,141
Moroccans
47.7
/100
|
#177
Average
$100,138
Immigrants | Cameroon
47.0
/100
|
#178
Average
$100,084
Belgians
46.7
/100
|
#179
Average
$100,060
Aleuts
46.6
/100
|
#180
Average
$100,052
Immigrants | Immigrants
45.3
/100
|
#181
Average
$99,943
Finns
44.8
/100
|
#182
Average
$99,904
Spaniards
44.6
/100
|
#183
Average
$99,889
French
43.8
/100
|
#184
Average
$99,824
Colombians
43.2
/100
|
#185
Average
$99,772
Dutch
41.7
/100
|
#186
Average
$99,650

Demographics Similar to Mongolians by Householder Income Ages 45 - 64 years

In terms of householder income ages 45 - 64 years, the demographic groups most similar to Mongolians are Immigrants from Norway ($111,669, a difference of 0.060%), Immigrants from Latvia ($111,454, a difference of 0.13%), Immigrants from Belarus ($111,430, a difference of 0.15%), Immigrants from Czechoslovakia ($111,914, a difference of 0.28%), and New Zealander ($111,286, a difference of 0.28%).
DemographicsRating | RankHouseholder Income Ages 45 - 64 years
Egyptians
99.7
/100
|
#56
Exceptional
$112,256
Immigrants | Scotland
99.7
/100
|
#57
Exceptional
$112,175
Soviet Union
99.7
/100
|
#58
Exceptional
$112,008
Immigrants | Europe
99.7
/100
|
#59
Exceptional
$111,984
Immigrants | Netherlands
99.7
/100
|
#60
Exceptional
$111,982
Immigrants | Czechoslovakia
99.7
/100
|
#61
Exceptional
$111,914
Immigrants | Norway
99.7
/100
|
#62
Exceptional
$111,669
Mongolians
99.6
/100
|
#63
Exceptional
$111,602
Immigrants | Latvia
99.6
/100
|
#64
Exceptional
$111,454
Immigrants | Belarus
99.6
/100
|
#65
Exceptional
$111,430
New Zealanders
99.6
/100
|
#66
Exceptional
$111,286
Laotians
99.5
/100
|
#67
Exceptional
$111,051
Immigrants | Romania
99.4
/100
|
#68
Exceptional
$110,633
Immigrants | Italy
99.4
/100
|
#69
Exceptional
$110,434
Koreans
99.3
/100
|
#70
Exceptional
$110,334