Fijian vs Cherokee Per Capita Income
COMPARE
Fijian
Cherokee
Per Capita Income
Per Capita Income Comparison
Fijians
Cherokee
$36,690
PER CAPITA INCOME
0.0/ 100
METRIC RATING
308th/ 347
METRIC RANK
$37,203
PER CAPITA INCOME
0.1/ 100
METRIC RATING
299th/ 347
METRIC RANK
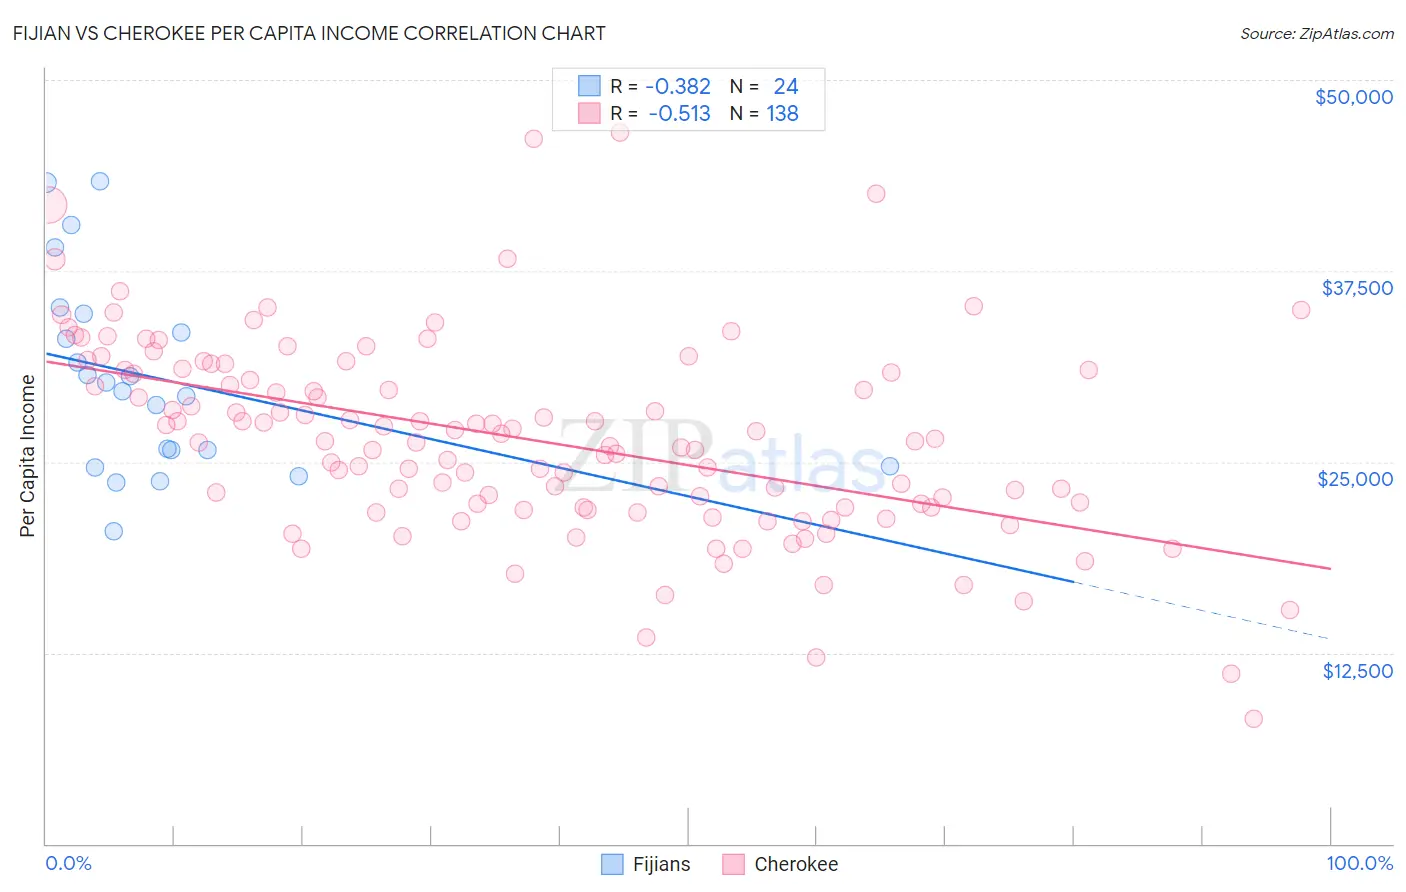
Fijian vs Cherokee Per Capita Income Correlation Chart
The statistical analysis conducted on geographies consisting of 55,948,768 people shows a mild negative correlation between the proportion of Fijians and per capita income in the United States with a correlation coefficient (R) of -0.382 and weighted average of $36,690. Similarly, the statistical analysis conducted on geographies consisting of 493,739,592 people shows a substantial negative correlation between the proportion of Cherokee and per capita income in the United States with a correlation coefficient (R) of -0.513 and weighted average of $37,203, a difference of 1.4%.
Per Capita Income Correlation Summary
| Measurement | Fijian | Cherokee |
| Minimum | $20,445 | $8,186 |
| Maximum | $43,340 | $46,594 |
| Range | $22,895 | $38,408 |
| Mean | $30,488 | $26,478 |
| Median | $29,934 | $26,343 |
| Interquartile 25% (IQ1) | $25,226 | $21,995 |
| Interquartile 75% (IQ3) | $34,063 | $30,981 |
| Interquartile Range (IQR) | $8,837 | $8,986 |
| Standard Deviation (Sample) | $6,360 | $6,463 |
| Standard Deviation (Population) | $6,227 | $6,439 |
Demographics Similar to Fijians and Cherokee by Per Capita Income
In terms of per capita income, the demographic groups most similar to Fijians are Immigrants from Honduras ($36,665, a difference of 0.070%), Ute ($36,651, a difference of 0.10%), Chippewa ($36,631, a difference of 0.16%), Immigrants from Latin America ($36,823, a difference of 0.36%), and Immigrants from Haiti ($36,849, a difference of 0.43%). Similarly, the demographic groups most similar to Cherokee are Immigrants from Bahamas ($37,193, a difference of 0.030%), Immigrants from Caribbean ($37,254, a difference of 0.14%), Haitian ($37,289, a difference of 0.23%), Indonesian ($37,300, a difference of 0.26%), and Immigrants from Dominican Republic ($37,306, a difference of 0.27%).
| Demographics | Rating | Rank | Per Capita Income |
| Mexican American Indians | 0.1 /100 | #293 | Tragic $37,407 |
| Cubans | 0.1 /100 | #294 | Tragic $37,383 |
| Immigrants | Dominican Republic | 0.1 /100 | #295 | Tragic $37,306 |
| Indonesians | 0.1 /100 | #296 | Tragic $37,300 |
| Haitians | 0.1 /100 | #297 | Tragic $37,289 |
| Immigrants | Caribbean | 0.1 /100 | #298 | Tragic $37,254 |
| Cherokee | 0.1 /100 | #299 | Tragic $37,203 |
| Immigrants | Bahamas | 0.1 /100 | #300 | Tragic $37,193 |
| Ottawa | 0.1 /100 | #301 | Tragic $37,101 |
| Shoshone | 0.1 /100 | #302 | Tragic $37,072 |
| Paiute | 0.1 /100 | #303 | Tragic $37,066 |
| Hondurans | 0.1 /100 | #304 | Tragic $37,031 |
| Inupiat | 0.1 /100 | #305 | Tragic $36,999 |
| Immigrants | Haiti | 0.0 /100 | #306 | Tragic $36,849 |
| Immigrants | Latin America | 0.0 /100 | #307 | Tragic $36,823 |
| Fijians | 0.0 /100 | #308 | Tragic $36,690 |
| Immigrants | Honduras | 0.0 /100 | #309 | Tragic $36,665 |
| Ute | 0.0 /100 | #310 | Tragic $36,651 |
| Chippewa | 0.0 /100 | #311 | Tragic $36,631 |
| Chickasaw | 0.0 /100 | #312 | Tragic $36,475 |
| Bahamians | 0.0 /100 | #313 | Tragic $36,427 |