Basque vs Trinidadian and Tobagonian Cognitive Disability
COMPARE
Basque
Trinidadian and Tobagonian
Cognitive Disability
Cognitive Disability Comparison
Basques
Trinidadians and Tobagonians
17.1%
COGNITIVE DISABILITY
85.5/ 100
METRIC RATING
150th/ 347
METRIC RANK
17.9%
COGNITIVE DISABILITY
0.8/ 100
METRIC RATING
245th/ 347
METRIC RANK
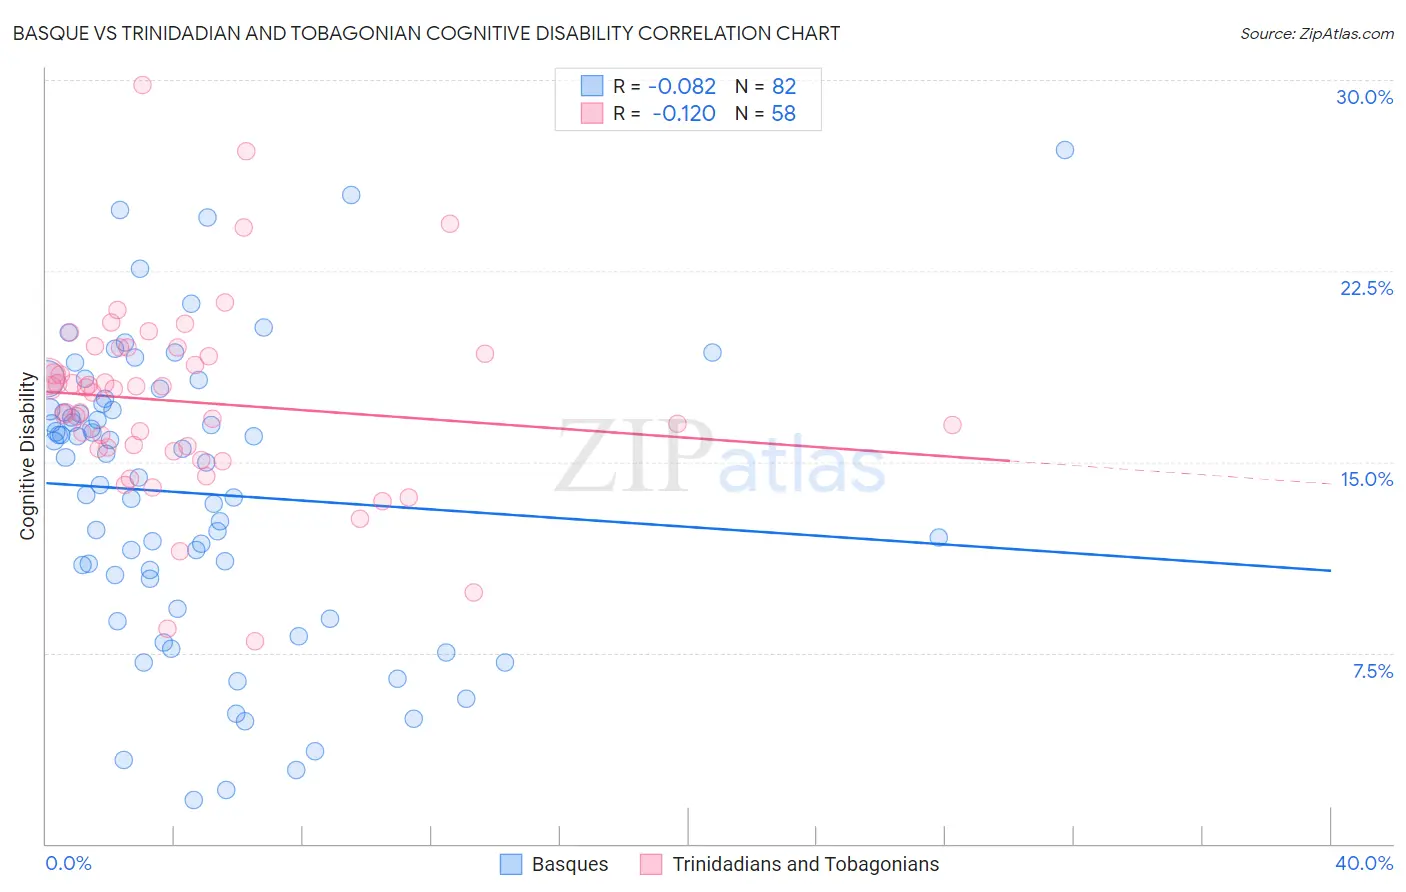
Basque vs Trinidadian and Tobagonian Cognitive Disability Correlation Chart
The statistical analysis conducted on geographies consisting of 165,778,299 people shows a slight negative correlation between the proportion of Basques and percentage of population with cognitive disability in the United States with a correlation coefficient (R) of -0.082 and weighted average of 17.1%. Similarly, the statistical analysis conducted on geographies consisting of 219,836,057 people shows a poor negative correlation between the proportion of Trinidadians and Tobagonians and percentage of population with cognitive disability in the United States with a correlation coefficient (R) of -0.120 and weighted average of 17.9%, a difference of 4.7%.
Cognitive Disability Correlation Summary
| Measurement | Basque | Trinidadian and Tobagonian |
| Minimum | 1.7% | 7.9% |
| Maximum | 27.3% | 29.8% |
| Range | 25.6% | 21.9% |
| Mean | 13.8% | 17.4% |
| Median | 15.1% | 17.8% |
| Interquartile 25% (IQ1) | 10.4% | 15.5% |
| Interquartile 75% (IQ3) | 17.1% | 19.2% |
| Interquartile Range (IQR) | 6.7% | 3.7% |
| Standard Deviation (Sample) | 5.7% | 3.8% |
| Standard Deviation (Population) | 5.6% | 3.8% |
Similar Demographics by Cognitive Disability
Demographics Similar to Basques by Cognitive Disability
In terms of cognitive disability, the demographic groups most similar to Basques are French Canadian (17.1%, a difference of 0.010%), Cypriot (17.1%, a difference of 0.010%), Scotch-Irish (17.1%, a difference of 0.030%), Syrian (17.1%, a difference of 0.13%), and Immigrants from Indonesia (17.1%, a difference of 0.15%).
| Demographics | Rating | Rank | Cognitive Disability |
| British | 89.3 /100 | #143 | Excellent 17.0% |
| Immigrants | Brazil | 89.3 /100 | #144 | Excellent 17.0% |
| Immigrants | South Eastern Asia | 88.7 /100 | #145 | Excellent 17.0% |
| Costa Ricans | 88.0 /100 | #146 | Excellent 17.0% |
| Scotch-Irish | 85.9 /100 | #147 | Excellent 17.1% |
| French Canadians | 85.7 /100 | #148 | Excellent 17.1% |
| Cypriots | 85.7 /100 | #149 | Excellent 17.1% |
| Basques | 85.5 /100 | #150 | Excellent 17.1% |
| Syrians | 83.0 /100 | #151 | Excellent 17.1% |
| Immigrants | Indonesia | 82.7 /100 | #152 | Excellent 17.1% |
| Immigrants | Kazakhstan | 80.5 /100 | #153 | Excellent 17.1% |
| Immigrants | Malaysia | 79.3 /100 | #154 | Good 17.1% |
| Brazilians | 78.9 /100 | #155 | Good 17.1% |
| Sri Lankans | 78.9 /100 | #156 | Good 17.1% |
| Immigrants | Australia | 76.0 /100 | #157 | Good 17.1% |
Demographics Similar to Trinidadians and Tobagonians by Cognitive Disability
In terms of cognitive disability, the demographic groups most similar to Trinidadians and Tobagonians are Immigrants from Thailand (17.9%, a difference of 0.020%), Jamaican (17.9%, a difference of 0.090%), Samoan (17.9%, a difference of 0.090%), French American Indian (17.9%, a difference of 0.10%), and Immigrants from Bangladesh (17.8%, a difference of 0.13%).
| Demographics | Rating | Rank | Cognitive Disability |
| Cheyenne | 1.7 /100 | #238 | Tragic 17.8% |
| Cajuns | 1.4 /100 | #239 | Tragic 17.8% |
| Iraqis | 1.4 /100 | #240 | Tragic 17.8% |
| Mexicans | 1.1 /100 | #241 | Tragic 17.8% |
| Paiute | 1.1 /100 | #242 | Tragic 17.8% |
| Immigrants | Bangladesh | 1.0 /100 | #243 | Tragic 17.8% |
| Jamaicans | 0.9 /100 | #244 | Tragic 17.9% |
| Trinidadians and Tobagonians | 0.8 /100 | #245 | Tragic 17.9% |
| Immigrants | Thailand | 0.8 /100 | #246 | Tragic 17.9% |
| Samoans | 0.7 /100 | #247 | Tragic 17.9% |
| French American Indians | 0.7 /100 | #248 | Tragic 17.9% |
| Cree | 0.7 /100 | #249 | Tragic 17.9% |
| Immigrants | Ethiopia | 0.7 /100 | #250 | Tragic 17.9% |
| Malaysians | 0.6 /100 | #251 | Tragic 17.9% |
| Immigrants | Grenada | 0.6 /100 | #252 | Tragic 17.9% |