Basque vs Romanian Median Earnings
COMPARE
Basque
Romanian
Median Earnings
Median Earnings Comparison
Basques
Romanians
$46,399
MEDIAN EARNINGS
48.8/ 100
METRIC RATING
175th/ 347
METRIC RANK
$50,244
MEDIAN EARNINGS
99.5/ 100
METRIC RATING
83rd/ 347
METRIC RANK
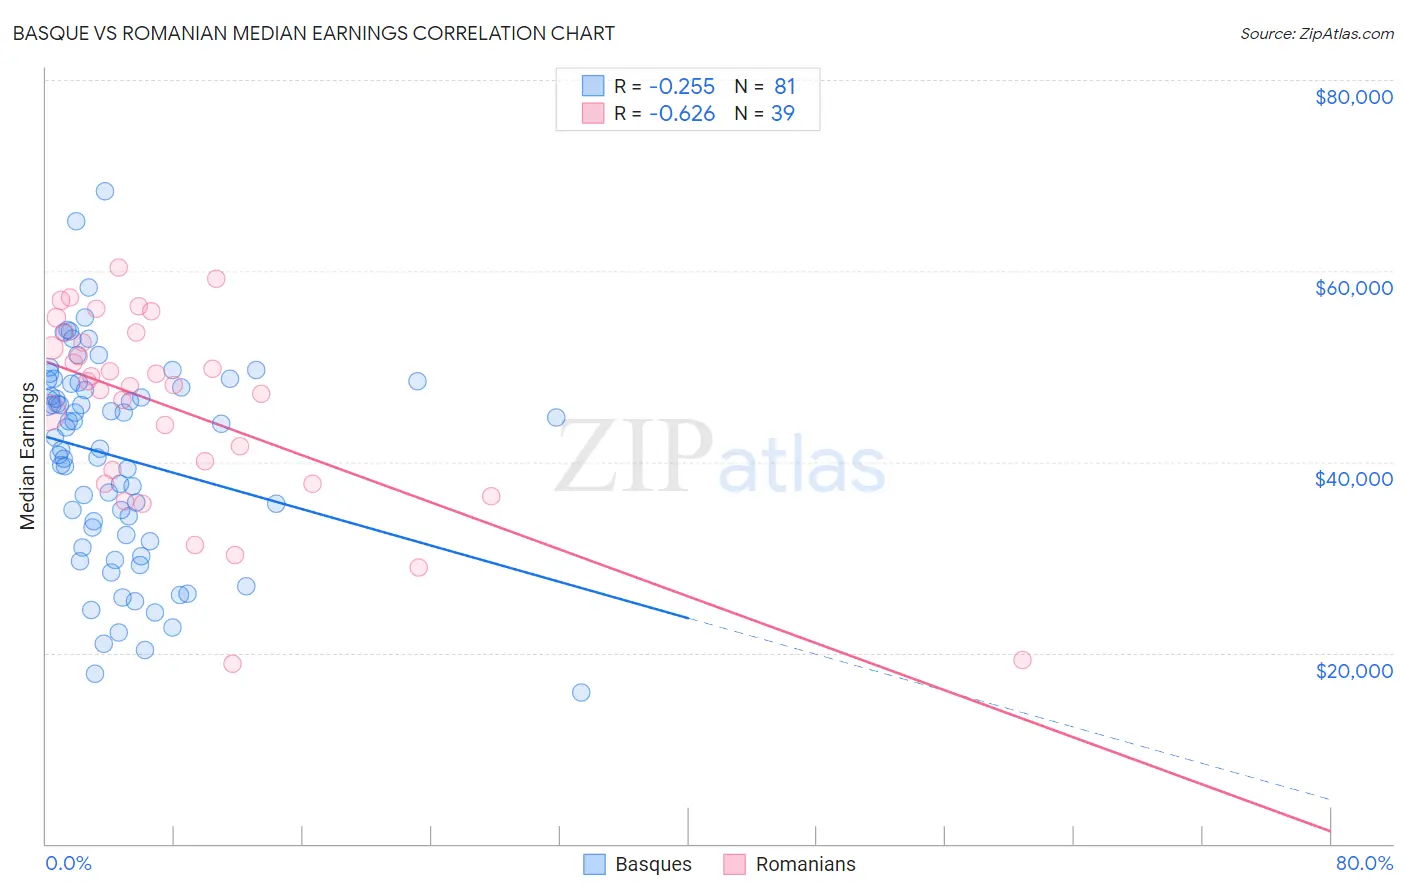
Basque vs Romanian Median Earnings Correlation Chart
The statistical analysis conducted on geographies consisting of 165,772,846 people shows a weak negative correlation between the proportion of Basques and median earnings in the United States with a correlation coefficient (R) of -0.255 and weighted average of $46,399. Similarly, the statistical analysis conducted on geographies consisting of 377,906,078 people shows a significant negative correlation between the proportion of Romanians and median earnings in the United States with a correlation coefficient (R) of -0.626 and weighted average of $50,244, a difference of 8.3%.
Median Earnings Correlation Summary
| Measurement | Basque | Romanian |
| Minimum | $15,833 | $18,814 |
| Maximum | $68,304 | $60,367 |
| Range | $52,471 | $41,553 |
| Mean | $40,382 | $45,500 |
| Median | $42,566 | $48,068 |
| Interquartile 25% (IQ1) | $32,007 | $37,750 |
| Interquartile 75% (IQ3) | $48,221 | $53,505 |
| Interquartile Range (IQR) | $16,214 | $15,755 |
| Standard Deviation (Sample) | $10,903 | $10,336 |
| Standard Deviation (Population) | $10,835 | $10,203 |
Similar Demographics by Median Earnings
Demographics Similar to Basques by Median Earnings
In terms of median earnings, the demographic groups most similar to Basques are Danish ($46,392, a difference of 0.020%), Belgian ($46,375, a difference of 0.050%), Scandinavian ($46,433, a difference of 0.070%), Ghanaian ($46,440, a difference of 0.090%), and Colombian ($46,349, a difference of 0.11%).
| Demographics | Rating | Rank | Median Earnings |
| Immigrants | Africa | 54.6 /100 | #168 | Average $46,564 |
| Immigrants | South America | 54.0 /100 | #169 | Average $46,548 |
| Immigrants | Immigrants | 51.6 /100 | #170 | Average $46,478 |
| Scottish | 51.1 /100 | #171 | Average $46,463 |
| Kenyans | 51.0 /100 | #172 | Average $46,462 |
| Ghanaians | 50.3 /100 | #173 | Average $46,440 |
| Scandinavians | 50.0 /100 | #174 | Average $46,433 |
| Basques | 48.8 /100 | #175 | Average $46,399 |
| Danes | 48.6 /100 | #176 | Average $46,392 |
| Belgians | 48.0 /100 | #177 | Average $46,375 |
| Colombians | 47.1 /100 | #178 | Average $46,349 |
| English | 46.5 /100 | #179 | Average $46,334 |
| Puget Sound Salish | 46.5 /100 | #180 | Average $46,333 |
| Immigrants | Cameroon | 46.4 /100 | #181 | Average $46,329 |
| Swiss | 45.9 /100 | #182 | Average $46,315 |
Demographics Similar to Romanians by Median Earnings
In terms of median earnings, the demographic groups most similar to Romanians are Immigrants from Hungary ($50,227, a difference of 0.030%), Immigrants from Kazakhstan ($50,225, a difference of 0.040%), Immigrants from Moldova ($50,274, a difference of 0.060%), Immigrants from Southern Europe ($50,280, a difference of 0.070%), and Immigrants from Canada ($50,192, a difference of 0.10%).
| Demographics | Rating | Rank | Median Earnings |
| Immigrants | Italy | 99.7 /100 | #76 | Exceptional $50,581 |
| Immigrants | Western Europe | 99.7 /100 | #77 | Exceptional $50,549 |
| Argentineans | 99.6 /100 | #78 | Exceptional $50,399 |
| Laotians | 99.6 /100 | #79 | Exceptional $50,343 |
| Ukrainians | 99.6 /100 | #80 | Exceptional $50,320 |
| Immigrants | Southern Europe | 99.6 /100 | #81 | Exceptional $50,280 |
| Immigrants | Moldova | 99.5 /100 | #82 | Exceptional $50,274 |
| Romanians | 99.5 /100 | #83 | Exceptional $50,244 |
| Immigrants | Hungary | 99.5 /100 | #84 | Exceptional $50,227 |
| Immigrants | Kazakhstan | 99.5 /100 | #85 | Exceptional $50,225 |
| Immigrants | Canada | 99.5 /100 | #86 | Exceptional $50,192 |
| Immigrants | Uzbekistan | 99.5 /100 | #87 | Exceptional $50,151 |
| Albanians | 99.4 /100 | #88 | Exceptional $50,116 |
| Immigrants | North America | 99.4 /100 | #89 | Exceptional $50,108 |
| Italians | 99.3 /100 | #90 | Exceptional $49,915 |