Basque vs Immigrants from Israel In Labor Force | Age 45-54
COMPARE
Basque
Immigrants from Israel
In Labor Force | Age 45-54
In Labor Force | Age 45-54 Comparison
Basques
Immigrants from Israel
82.0%
IN LABOR FORCE | AGE 45-54
1.2/ 100
METRIC RATING
236th/ 347
METRIC RANK
83.1%
IN LABOR FORCE | AGE 45-54
84.7/ 100
METRIC RATING
130th/ 347
METRIC RANK
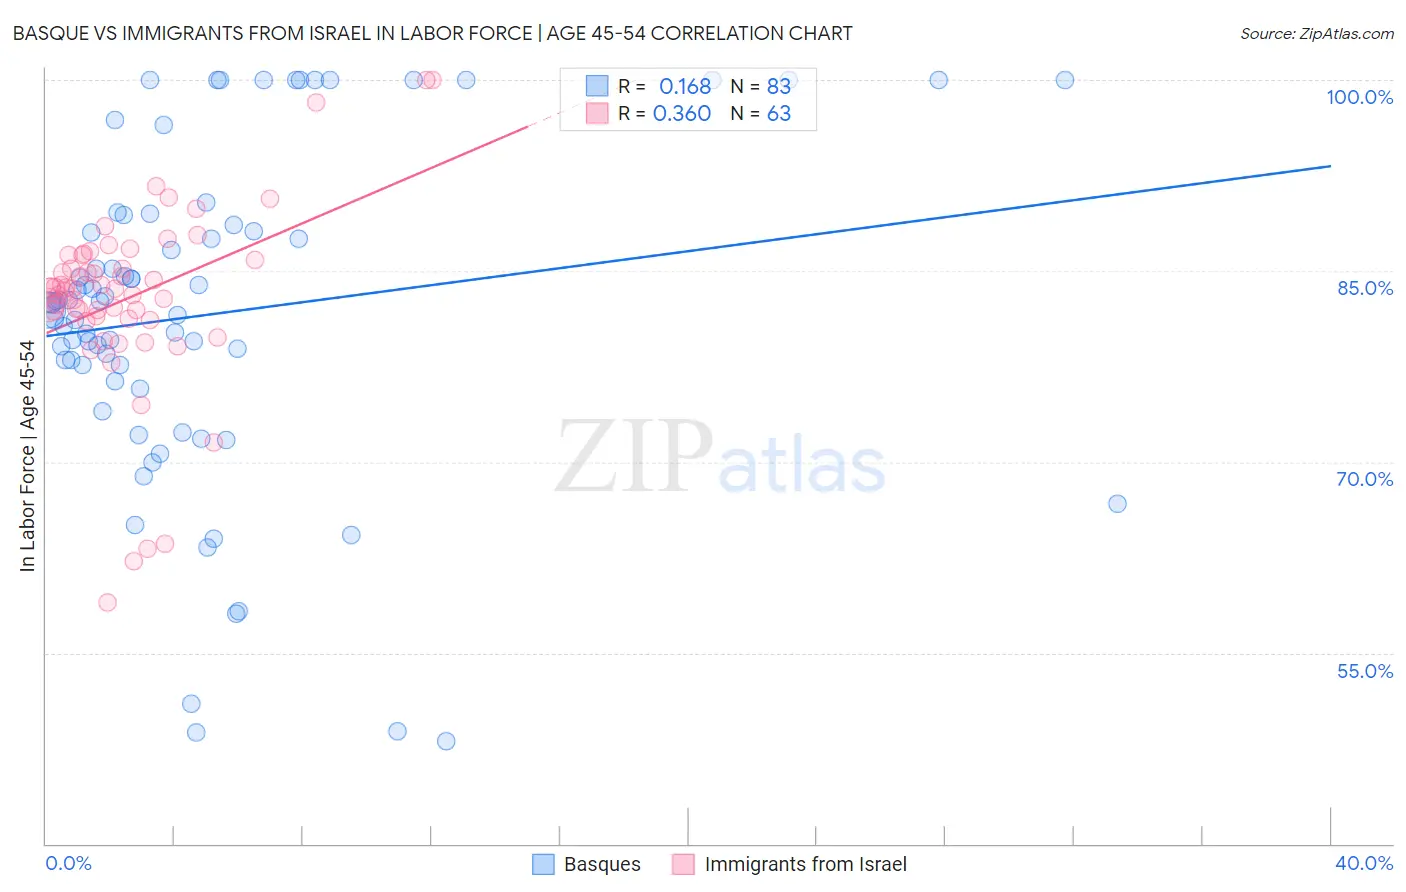
Basque vs Immigrants from Israel In Labor Force | Age 45-54 Correlation Chart
The statistical analysis conducted on geographies consisting of 165,745,379 people shows a poor positive correlation between the proportion of Basques and labor force participation rate among population between the ages 45 and 54 in the United States with a correlation coefficient (R) of 0.168 and weighted average of 82.0%. Similarly, the statistical analysis conducted on geographies consisting of 209,979,344 people shows a mild positive correlation between the proportion of Immigrants from Israel and labor force participation rate among population between the ages 45 and 54 in the United States with a correlation coefficient (R) of 0.360 and weighted average of 83.1%, a difference of 1.4%.
In Labor Force | Age 45-54 Correlation Summary
| Measurement | Basque | Immigrants from Israel |
| Minimum | 48.1% | 59.0% |
| Maximum | 100.0% | 100.0% |
| Range | 51.9% | 41.0% |
| Mean | 81.6% | 82.9% |
| Median | 82.5% | 83.6% |
| Interquartile 25% (IQ1) | 76.3% | 81.2% |
| Interquartile 75% (IQ3) | 88.6% | 86.2% |
| Interquartile Range (IQR) | 12.3% | 5.0% |
| Standard Deviation (Sample) | 12.9% | 7.4% |
| Standard Deviation (Population) | 12.8% | 7.3% |
Similar Demographics by In Labor Force | Age 45-54
Demographics Similar to Basques by In Labor Force | Age 45-54
In terms of in labor force | age 45-54, the demographic groups most similar to Basques are Subsaharan African (82.0%, a difference of 0.010%), Immigrants from Trinidad and Tobago (82.0%, a difference of 0.010%), Trinidadian and Tobagonian (81.9%, a difference of 0.010%), Immigrants from Thailand (81.9%, a difference of 0.040%), and Immigrants from El Salvador (81.9%, a difference of 0.050%).
| Demographics | Rating | Rank | In Labor Force | Age 45-54 |
| Immigrants | Burma/Myanmar | 1.9 /100 | #229 | Tragic 82.0% |
| Jamaicans | 1.8 /100 | #230 | Tragic 82.0% |
| Immigrants | Senegal | 1.7 /100 | #231 | Tragic 82.0% |
| Immigrants | Portugal | 1.7 /100 | #232 | Tragic 82.0% |
| Malaysians | 1.7 /100 | #233 | Tragic 82.0% |
| Salvadorans | 1.7 /100 | #234 | Tragic 82.0% |
| Sub-Saharan Africans | 1.2 /100 | #235 | Tragic 82.0% |
| Basques | 1.2 /100 | #236 | Tragic 82.0% |
| Immigrants | Trinidad and Tobago | 1.2 /100 | #237 | Tragic 82.0% |
| Trinidadians and Tobagonians | 1.1 /100 | #238 | Tragic 81.9% |
| Immigrants | Thailand | 1.0 /100 | #239 | Tragic 81.9% |
| Immigrants | El Salvador | 1.0 /100 | #240 | Tragic 81.9% |
| Immigrants | Cambodia | 0.8 /100 | #241 | Tragic 81.9% |
| Whites/Caucasians | 0.7 /100 | #242 | Tragic 81.9% |
| Samoans | 0.6 /100 | #243 | Tragic 81.8% |
Demographics Similar to Immigrants from Israel by In Labor Force | Age 45-54
In terms of in labor force | age 45-54, the demographic groups most similar to Immigrants from Israel are Immigrants from Jordan (83.1%, a difference of 0.010%), German (83.1%, a difference of 0.010%), Immigrants from Northern Europe (83.1%, a difference of 0.010%), Finnish (83.1%, a difference of 0.020%), and Immigrants from Belgium (83.1%, a difference of 0.030%).
| Demographics | Rating | Rank | In Labor Force | Age 45-54 |
| Tongans | 88.2 /100 | #123 | Excellent 83.1% |
| Bermudans | 88.0 /100 | #124 | Excellent 83.1% |
| Immigrants | Iran | 87.2 /100 | #125 | Excellent 83.1% |
| Immigrants | Belgium | 86.4 /100 | #126 | Excellent 83.1% |
| Immigrants | Jordan | 85.2 /100 | #127 | Excellent 83.1% |
| Germans | 85.1 /100 | #128 | Excellent 83.1% |
| Immigrants | Northern Europe | 85.1 /100 | #129 | Excellent 83.1% |
| Immigrants | Israel | 84.7 /100 | #130 | Excellent 83.1% |
| Finns | 83.3 /100 | #131 | Excellent 83.1% |
| Immigrants | Ukraine | 82.9 /100 | #132 | Excellent 83.0% |
| Liberians | 82.7 /100 | #133 | Excellent 83.0% |
| Sudanese | 82.0 /100 | #134 | Excellent 83.0% |
| Austrians | 81.3 /100 | #135 | Excellent 83.0% |
| Immigrants | Kazakhstan | 81.0 /100 | #136 | Excellent 83.0% |
| Immigrants | Spain | 80.4 /100 | #137 | Excellent 83.0% |