Barbadian vs Immigrants from Uzbekistan Median Household Income
COMPARE
Barbadian
Immigrants from Uzbekistan
Median Household Income
Median Household Income Comparison
Barbadians
Immigrants from Uzbekistan
$79,664
MEDIAN HOUSEHOLD INCOME
3.0/ 100
METRIC RATING
238th/ 347
METRIC RANK
$86,425
MEDIAN HOUSEHOLD INCOME
70.1/ 100
METRIC RATING
159th/ 347
METRIC RANK
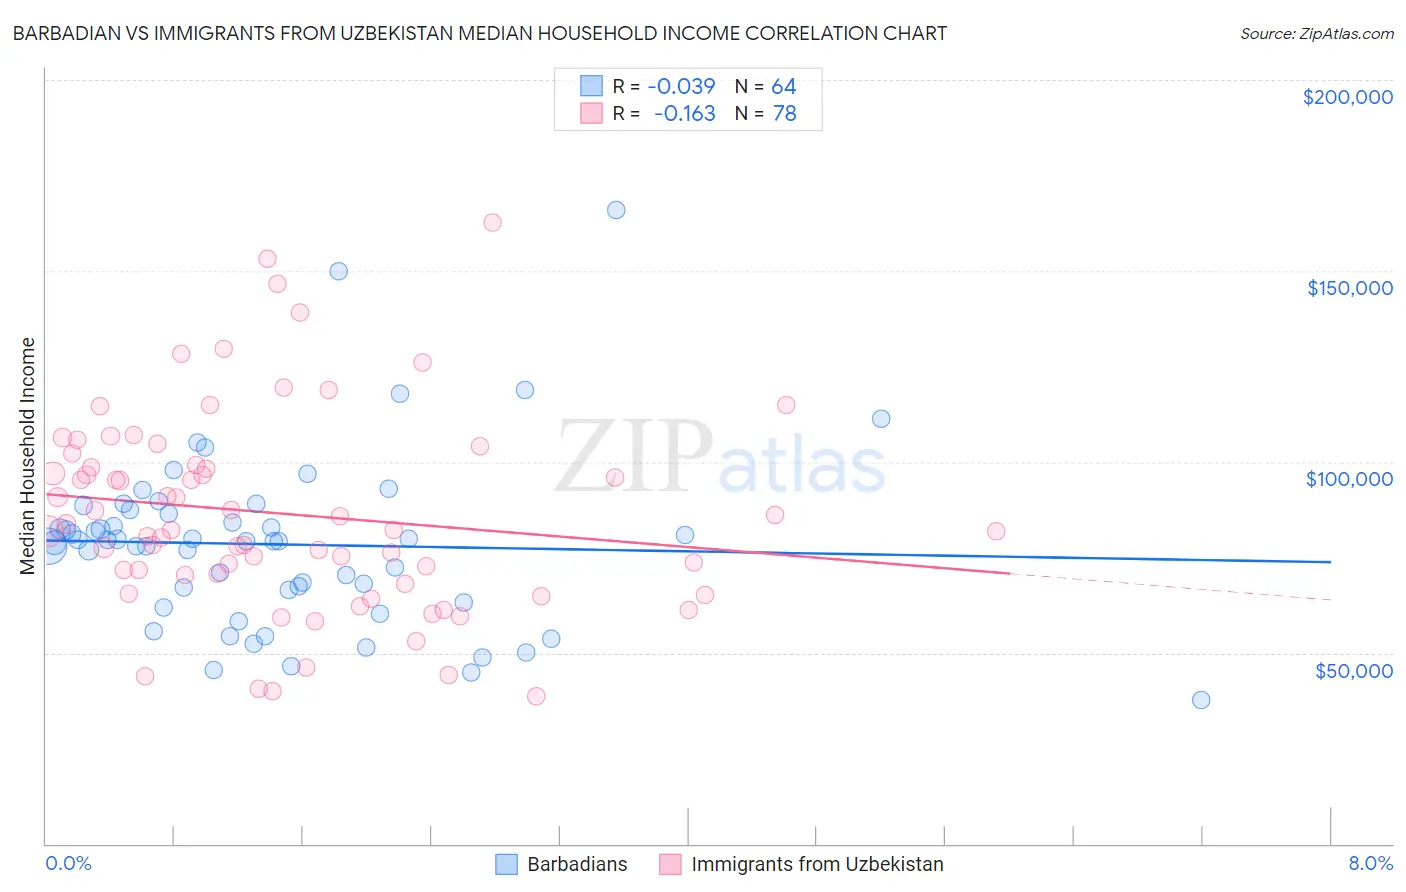
Barbadian vs Immigrants from Uzbekistan Median Household Income Correlation Chart
The statistical analysis conducted on geographies consisting of 141,253,267 people shows no correlation between the proportion of Barbadians and median household income in the United States with a correlation coefficient (R) of -0.039 and weighted average of $79,664. Similarly, the statistical analysis conducted on geographies consisting of 118,697,926 people shows a poor negative correlation between the proportion of Immigrants from Uzbekistan and median household income in the United States with a correlation coefficient (R) of -0.163 and weighted average of $86,425, a difference of 8.5%.
Median Household Income Correlation Summary
| Measurement | Barbadian | Immigrants from Uzbekistan |
| Minimum | $37,500 | $38,670 |
| Maximum | $166,111 | $162,808 |
| Range | $128,611 | $124,138 |
| Mean | $78,382 | $86,352 |
| Median | $79,225 | $82,168 |
| Interquartile 25% (IQ1) | $64,694 | $70,322 |
| Interquartile 75% (IQ3) | $86,916 | $99,228 |
| Interquartile Range (IQR) | $22,222 | $28,906 |
| Standard Deviation (Sample) | $22,744 | $26,082 |
| Standard Deviation (Population) | $22,565 | $25,914 |
Similar Demographics by Median Household Income
Demographics Similar to Barbadians by Median Household Income
In terms of median household income, the demographic groups most similar to Barbadians are Nicaraguan ($79,737, a difference of 0.090%), Alaska Native ($79,509, a difference of 0.20%), Immigrants from Western Africa ($79,490, a difference of 0.22%), Immigrants from Bosnia and Herzegovina ($79,888, a difference of 0.28%), and Nonimmigrants ($79,429, a difference of 0.30%).
| Demographics | Rating | Rank | Median Household Income |
| Trinidadians and Tobagonians | 4.7 /100 | #231 | Tragic $80,402 |
| Immigrants | Trinidad and Tobago | 4.6 /100 | #232 | Tragic $80,373 |
| Immigrants | Azores | 4.5 /100 | #233 | Tragic $80,357 |
| Immigrants | Ecuador | 4.5 /100 | #234 | Tragic $80,341 |
| Immigrants | Guyana | 4.5 /100 | #235 | Tragic $80,324 |
| Immigrants | Bosnia and Herzegovina | 3.4 /100 | #236 | Tragic $79,888 |
| Nicaraguans | 3.1 /100 | #237 | Tragic $79,737 |
| Barbadians | 3.0 /100 | #238 | Tragic $79,664 |
| Alaska Natives | 2.7 /100 | #239 | Tragic $79,509 |
| Immigrants | Western Africa | 2.7 /100 | #240 | Tragic $79,490 |
| Immigrants | Nonimmigrants | 2.6 /100 | #241 | Tragic $79,429 |
| Immigrants | Sudan | 2.1 /100 | #242 | Tragic $79,103 |
| Immigrants | Barbados | 1.9 /100 | #243 | Tragic $78,989 |
| Marshallese | 1.9 /100 | #244 | Tragic $78,930 |
| Inupiat | 1.8 /100 | #245 | Tragic $78,841 |
Demographics Similar to Immigrants from Uzbekistan by Median Household Income
In terms of median household income, the demographic groups most similar to Immigrants from Uzbekistan are Luxembourger ($86,418, a difference of 0.010%), Slavic ($86,398, a difference of 0.030%), Moroccan ($86,468, a difference of 0.050%), Samoan ($86,498, a difference of 0.080%), and Immigrants from Albania ($86,534, a difference of 0.13%).
| Demographics | Rating | Rank | Median Household Income |
| Immigrants | Saudi Arabia | 75.8 /100 | #152 | Good $86,875 |
| South Americans | 75.1 /100 | #153 | Good $86,824 |
| Immigrants | Germany | 74.4 /100 | #154 | Good $86,764 |
| Carpatho Rusyns | 72.8 /100 | #155 | Good $86,635 |
| Immigrants | Albania | 71.5 /100 | #156 | Good $86,534 |
| Samoans | 71.0 /100 | #157 | Good $86,498 |
| Moroccans | 70.6 /100 | #158 | Good $86,468 |
| Immigrants | Uzbekistan | 70.1 /100 | #159 | Good $86,425 |
| Luxembourgers | 70.0 /100 | #160 | Good $86,418 |
| Slavs | 69.7 /100 | #161 | Good $86,398 |
| Guamanians/Chamorros | 67.7 /100 | #162 | Good $86,255 |
| Czechs | 66.4 /100 | #163 | Good $86,164 |
| Irish | 66.2 /100 | #164 | Good $86,145 |
| Norwegians | 65.3 /100 | #165 | Good $86,084 |
| Scandinavians | 65.1 /100 | #166 | Good $86,073 |