Barbadian vs Creek Median Household Income
COMPARE
Barbadian
Creek
Median Household Income
Median Household Income Comparison
Barbadians
Creek
$79,664
MEDIAN HOUSEHOLD INCOME
3.0/ 100
METRIC RATING
238th/ 347
METRIC RANK
$67,715
MEDIAN HOUSEHOLD INCOME
0.0/ 100
METRIC RATING
333rd/ 347
METRIC RANK
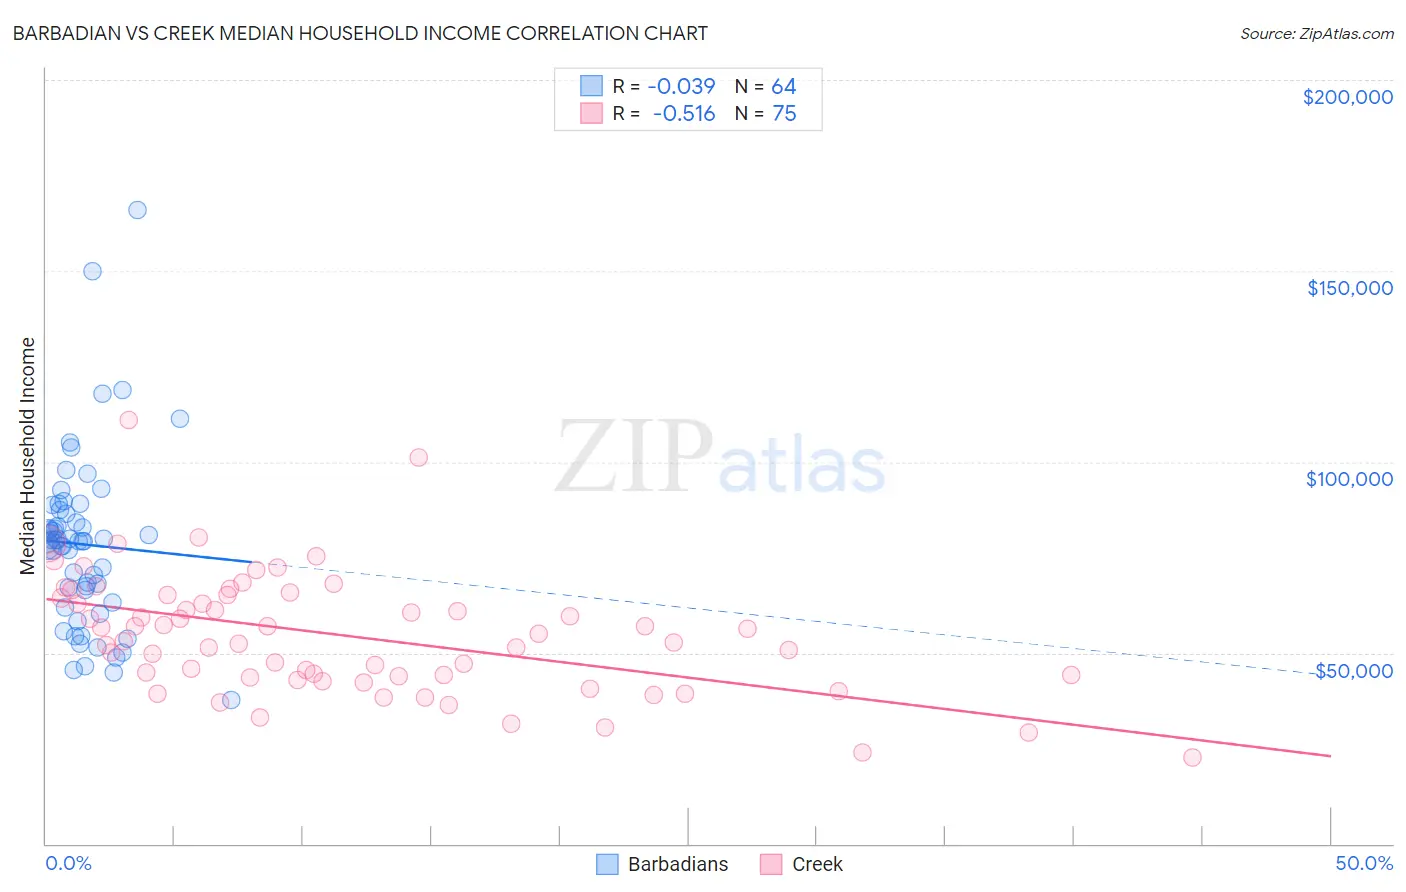
Barbadian vs Creek Median Household Income Correlation Chart
The statistical analysis conducted on geographies consisting of 141,253,267 people shows no correlation between the proportion of Barbadians and median household income in the United States with a correlation coefficient (R) of -0.039 and weighted average of $79,664. Similarly, the statistical analysis conducted on geographies consisting of 178,405,677 people shows a substantial negative correlation between the proportion of Creek and median household income in the United States with a correlation coefficient (R) of -0.516 and weighted average of $67,715, a difference of 17.6%.
Median Household Income Correlation Summary
| Measurement | Barbadian | Creek |
| Minimum | $37,500 | $22,500 |
| Maximum | $166,111 | $111,063 |
| Range | $128,611 | $88,563 |
| Mean | $78,382 | $54,543 |
| Median | $79,225 | $53,166 |
| Interquartile 25% (IQ1) | $64,694 | $43,621 |
| Interquartile 75% (IQ3) | $86,916 | $65,130 |
| Interquartile Range (IQR) | $22,222 | $21,509 |
| Standard Deviation (Sample) | $22,744 | $15,915 |
| Standard Deviation (Population) | $22,565 | $15,809 |
Similar Demographics by Median Household Income
Demographics Similar to Barbadians by Median Household Income
In terms of median household income, the demographic groups most similar to Barbadians are Nicaraguan ($79,737, a difference of 0.090%), Alaska Native ($79,509, a difference of 0.20%), Immigrants from Western Africa ($79,490, a difference of 0.22%), Immigrants from Bosnia and Herzegovina ($79,888, a difference of 0.28%), and Nonimmigrants ($79,429, a difference of 0.30%).
| Demographics | Rating | Rank | Median Household Income |
| Trinidadians and Tobagonians | 4.7 /100 | #231 | Tragic $80,402 |
| Immigrants | Trinidad and Tobago | 4.6 /100 | #232 | Tragic $80,373 |
| Immigrants | Azores | 4.5 /100 | #233 | Tragic $80,357 |
| Immigrants | Ecuador | 4.5 /100 | #234 | Tragic $80,341 |
| Immigrants | Guyana | 4.5 /100 | #235 | Tragic $80,324 |
| Immigrants | Bosnia and Herzegovina | 3.4 /100 | #236 | Tragic $79,888 |
| Nicaraguans | 3.1 /100 | #237 | Tragic $79,737 |
| Barbadians | 3.0 /100 | #238 | Tragic $79,664 |
| Alaska Natives | 2.7 /100 | #239 | Tragic $79,509 |
| Immigrants | Western Africa | 2.7 /100 | #240 | Tragic $79,490 |
| Immigrants | Nonimmigrants | 2.6 /100 | #241 | Tragic $79,429 |
| Immigrants | Sudan | 2.1 /100 | #242 | Tragic $79,103 |
| Immigrants | Barbados | 1.9 /100 | #243 | Tragic $78,989 |
| Marshallese | 1.9 /100 | #244 | Tragic $78,930 |
| Inupiat | 1.8 /100 | #245 | Tragic $78,841 |
Demographics Similar to Creek by Median Household Income
In terms of median household income, the demographic groups most similar to Creek are Sioux ($67,792, a difference of 0.11%), Black/African American ($67,573, a difference of 0.21%), Native/Alaskan ($67,879, a difference of 0.24%), Arapaho ($67,965, a difference of 0.37%), and Dutch West Indian ($68,412, a difference of 1.0%).
| Demographics | Rating | Rank | Median Household Income |
| Yuman | 0.0 /100 | #326 | Tragic $68,743 |
| Immigrants | Cuba | 0.0 /100 | #327 | Tragic $68,461 |
| Menominee | 0.0 /100 | #328 | Tragic $68,423 |
| Dutch West Indians | 0.0 /100 | #329 | Tragic $68,412 |
| Arapaho | 0.0 /100 | #330 | Tragic $67,965 |
| Natives/Alaskans | 0.0 /100 | #331 | Tragic $67,879 |
| Sioux | 0.0 /100 | #332 | Tragic $67,792 |
| Creek | 0.0 /100 | #333 | Tragic $67,715 |
| Blacks/African Americans | 0.0 /100 | #334 | Tragic $67,573 |
| Cheyenne | 0.0 /100 | #335 | Tragic $66,974 |
| Immigrants | Congo | 0.0 /100 | #336 | Tragic $66,768 |
| Kiowa | 0.0 /100 | #337 | Tragic $65,914 |
| Immigrants | Yemen | 0.0 /100 | #338 | Tragic $65,194 |
| Hopi | 0.0 /100 | #339 | Tragic $65,043 |
| Pueblo | 0.0 /100 | #340 | Tragic $64,692 |