Alsatian vs Osage Median Earnings
COMPARE
Alsatian
Osage
Median Earnings
Median Earnings Comparison
Alsatians
Osage
$47,023
MEDIAN EARNINGS
69.6/ 100
METRIC RATING
160th/ 347
METRIC RANK
$42,651
MEDIAN EARNINGS
0.5/ 100
METRIC RATING
270th/ 347
METRIC RANK
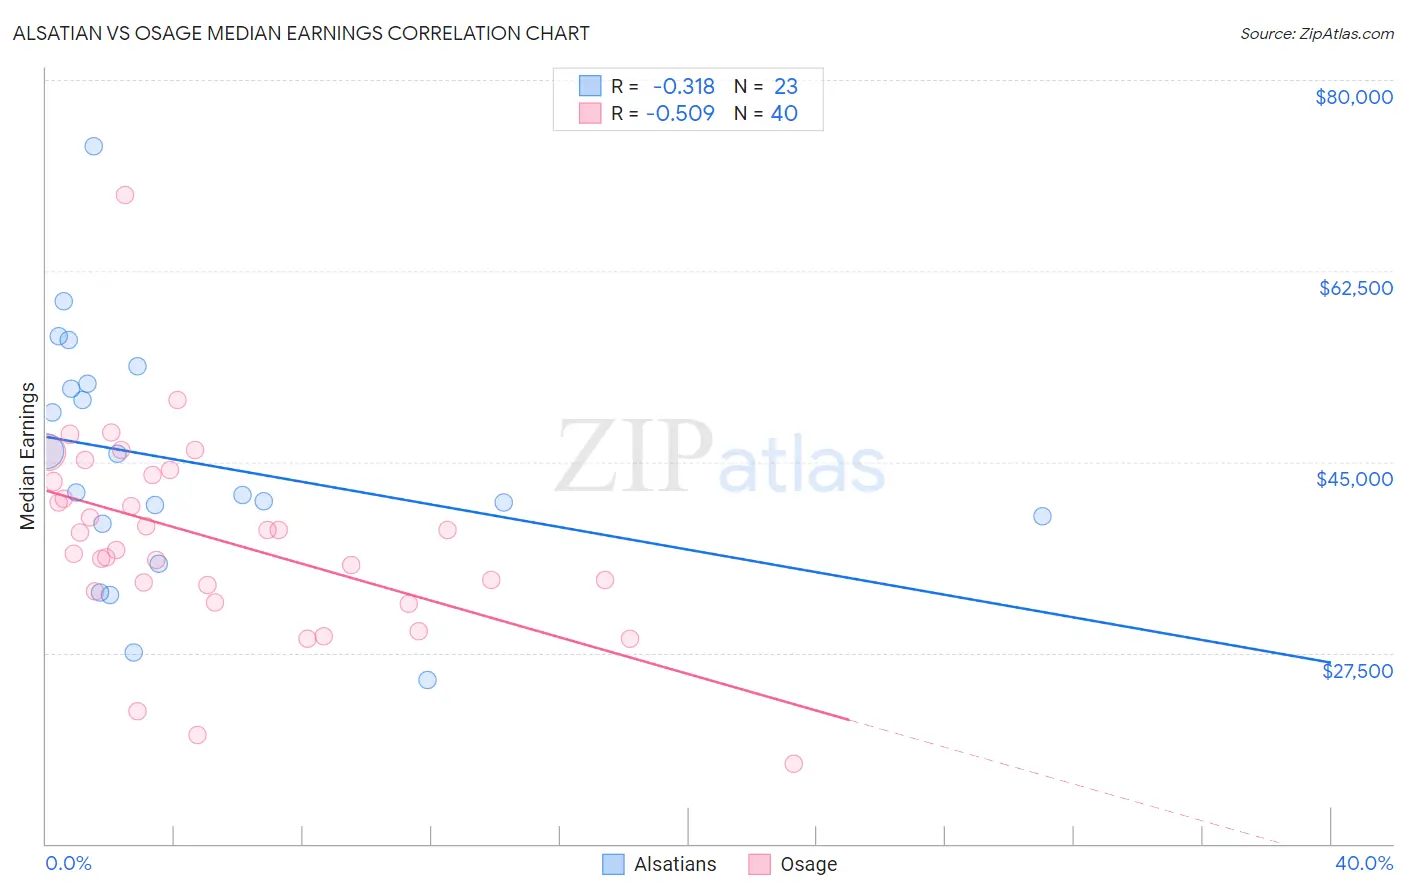
Alsatian vs Osage Median Earnings Correlation Chart
The statistical analysis conducted on geographies consisting of 82,677,221 people shows a mild negative correlation between the proportion of Alsatians and median earnings in the United States with a correlation coefficient (R) of -0.318 and weighted average of $47,023. Similarly, the statistical analysis conducted on geographies consisting of 91,804,179 people shows a substantial negative correlation between the proportion of Osage and median earnings in the United States with a correlation coefficient (R) of -0.509 and weighted average of $42,651, a difference of 10.2%.
Median Earnings Correlation Summary
| Measurement | Alsatian | Osage |
| Minimum | $25,064 | $17,308 |
| Maximum | $73,935 | $69,422 |
| Range | $48,871 | $52,114 |
| Mean | $45,093 | $37,848 |
| Median | $42,188 | $37,712 |
| Interquartile 25% (IQ1) | $39,345 | $33,454 |
| Interquartile 75% (IQ3) | $52,137 | $43,538 |
| Interquartile Range (IQR) | $12,792 | $10,084 |
| Standard Deviation (Sample) | $11,160 | $9,089 |
| Standard Deviation (Population) | $10,915 | $8,975 |
Similar Demographics by Median Earnings
Demographics Similar to Alsatians by Median Earnings
In terms of median earnings, the demographic groups most similar to Alsatians are Immigrants from Peru ($47,025, a difference of 0.0%), Immigrants from Eastern Africa ($46,969, a difference of 0.11%), Slovak ($47,095, a difference of 0.15%), South American Indian ($46,952, a difference of 0.15%), and Icelander ($46,916, a difference of 0.23%).
| Demographics | Rating | Rank | Median Earnings |
| Slavs | 81.1 /100 | #153 | Excellent $47,470 |
| Immigrants | Portugal | 77.3 /100 | #154 | Good $47,304 |
| Immigrants | Vietnam | 76.7 /100 | #155 | Good $47,282 |
| Irish | 76.6 /100 | #156 | Good $47,276 |
| Czechs | 75.1 /100 | #157 | Good $47,221 |
| Slovaks | 71.7 /100 | #158 | Good $47,095 |
| Immigrants | Peru | 69.6 /100 | #159 | Good $47,025 |
| Alsatians | 69.6 /100 | #160 | Good $47,023 |
| Immigrants | Eastern Africa | 68.0 /100 | #161 | Good $46,969 |
| South American Indians | 67.4 /100 | #162 | Good $46,952 |
| Icelanders | 66.3 /100 | #163 | Good $46,916 |
| Norwegians | 64.7 /100 | #164 | Good $46,865 |
| South Americans | 62.7 /100 | #165 | Good $46,804 |
| Czechoslovakians | 57.8 /100 | #166 | Average $46,658 |
| Costa Ricans | 57.4 /100 | #167 | Average $46,645 |
Demographics Similar to Osage by Median Earnings
In terms of median earnings, the demographic groups most similar to Osage are Pennsylvania German ($42,615, a difference of 0.090%), Belizean ($42,702, a difference of 0.12%), American ($42,742, a difference of 0.21%), Cree ($42,777, a difference of 0.29%), and Iroquois ($42,430, a difference of 0.52%).
| Demographics | Rating | Rank | Median Earnings |
| Inupiat | 0.8 /100 | #263 | Tragic $43,000 |
| Immigrants | Liberia | 0.7 /100 | #264 | Tragic $42,923 |
| Salvadorans | 0.7 /100 | #265 | Tragic $42,912 |
| Immigrants | Laos | 0.7 /100 | #266 | Tragic $42,884 |
| Cree | 0.6 /100 | #267 | Tragic $42,777 |
| Americans | 0.6 /100 | #268 | Tragic $42,742 |
| Belizeans | 0.5 /100 | #269 | Tragic $42,702 |
| Osage | 0.5 /100 | #270 | Tragic $42,651 |
| Pennsylvania Germans | 0.5 /100 | #271 | Tragic $42,615 |
| Iroquois | 0.4 /100 | #272 | Tragic $42,430 |
| Immigrants | Dominica | 0.4 /100 | #273 | Tragic $42,420 |
| Immigrants | El Salvador | 0.4 /100 | #274 | Tragic $42,413 |
| Immigrants | Belize | 0.3 /100 | #275 | Tragic $42,339 |
| Spanish Americans | 0.3 /100 | #276 | Tragic $42,316 |
| Central Americans | 0.3 /100 | #277 | Tragic $42,280 |