Bahamian vs Immigrants from Cuba Poverty
COMPARE
Bahamian
Immigrants from Cuba
Poverty
Poverty Comparison
Bahamians
Immigrants from Cuba
15.4%
POVERTY
0.0/ 100
METRIC RATING
301st/ 347
METRIC RANK
14.6%
POVERTY
0.1/ 100
METRIC RATING
269th/ 347
METRIC RANK
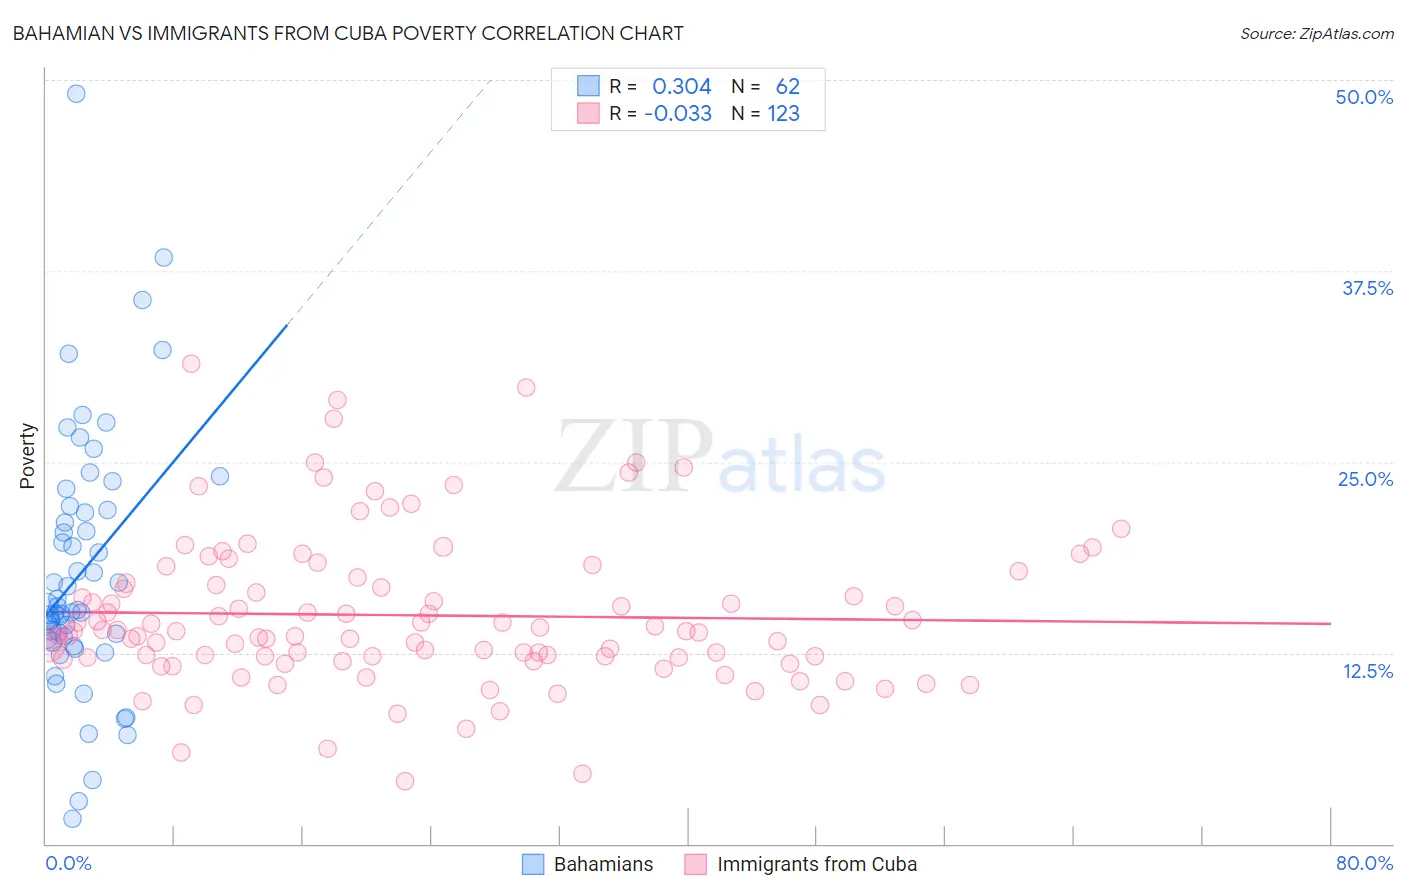
Bahamian vs Immigrants from Cuba Poverty Correlation Chart
The statistical analysis conducted on geographies consisting of 112,639,225 people shows a mild positive correlation between the proportion of Bahamians and poverty level in the United States with a correlation coefficient (R) of 0.304 and weighted average of 15.4%. Similarly, the statistical analysis conducted on geographies consisting of 325,967,480 people shows no correlation between the proportion of Immigrants from Cuba and poverty level in the United States with a correlation coefficient (R) of -0.033 and weighted average of 14.6%, a difference of 5.8%.
Poverty Correlation Summary
| Measurement | Bahamian | Immigrants from Cuba |
| Minimum | 1.7% | 4.1% |
| Maximum | 49.1% | 31.4% |
| Range | 47.4% | 27.3% |
| Mean | 17.8% | 15.0% |
| Median | 15.4% | 13.9% |
| Interquartile 25% (IQ1) | 13.4% | 12.2% |
| Interquartile 75% (IQ3) | 21.8% | 17.1% |
| Interquartile Range (IQR) | 8.4% | 4.9% |
| Standard Deviation (Sample) | 8.5% | 5.0% |
| Standard Deviation (Population) | 8.4% | 5.0% |
Similar Demographics by Poverty
Demographics Similar to Bahamians by Poverty
In terms of poverty, the demographic groups most similar to Bahamians are Somali (15.4%, a difference of 0.13%), Immigrants from Central America (15.4%, a difference of 0.21%), Senegalese (15.3%, a difference of 0.59%), Immigrants from Caribbean (15.5%, a difference of 0.61%), and Immigrants from Senegal (15.3%, a difference of 0.68%).
| Demographics | Rating | Rank | Poverty |
| Blackfeet | 0.0 /100 | #294 | Tragic 15.2% |
| Guatemalans | 0.0 /100 | #295 | Tragic 15.3% |
| Hispanics or Latinos | 0.0 /100 | #296 | Tragic 15.3% |
| Immigrants | Bangladesh | 0.0 /100 | #297 | Tragic 15.3% |
| Immigrants | Senegal | 0.0 /100 | #298 | Tragic 15.3% |
| Senegalese | 0.0 /100 | #299 | Tragic 15.3% |
| Immigrants | Central America | 0.0 /100 | #300 | Tragic 15.4% |
| Bahamians | 0.0 /100 | #301 | Tragic 15.4% |
| Somalis | 0.0 /100 | #302 | Tragic 15.4% |
| Immigrants | Caribbean | 0.0 /100 | #303 | Tragic 15.5% |
| Immigrants | Mexico | 0.0 /100 | #304 | Tragic 15.5% |
| Immigrants | Guatemala | 0.0 /100 | #305 | Tragic 15.5% |
| Creek | 0.0 /100 | #306 | Tragic 15.6% |
| Africans | 0.0 /100 | #307 | Tragic 15.6% |
| Choctaw | 0.0 /100 | #308 | Tragic 15.6% |
Demographics Similar to Immigrants from Cuba by Poverty
In terms of poverty, the demographic groups most similar to Immigrants from Cuba are Central American (14.6%, a difference of 0.14%), Subsaharan African (14.5%, a difference of 0.15%), Iroquois (14.5%, a difference of 0.19%), Guyanese (14.5%, a difference of 0.51%), and Immigrants from Guyana (14.5%, a difference of 0.68%).
| Demographics | Rating | Rank | Poverty |
| Immigrants | Liberia | 0.1 /100 | #262 | Tragic 14.4% |
| Jamaicans | 0.1 /100 | #263 | Tragic 14.4% |
| Immigrants | Jamaica | 0.1 /100 | #264 | Tragic 14.4% |
| Immigrants | Guyana | 0.1 /100 | #265 | Tragic 14.5% |
| Guyanese | 0.1 /100 | #266 | Tragic 14.5% |
| Iroquois | 0.1 /100 | #267 | Tragic 14.5% |
| Sub-Saharan Africans | 0.1 /100 | #268 | Tragic 14.5% |
| Immigrants | Cuba | 0.1 /100 | #269 | Tragic 14.6% |
| Central Americans | 0.1 /100 | #270 | Tragic 14.6% |
| Shoshone | 0.0 /100 | #271 | Tragic 14.7% |
| Chickasaw | 0.0 /100 | #272 | Tragic 14.7% |
| Spanish Americans | 0.0 /100 | #273 | Tragic 14.7% |
| Barbadians | 0.0 /100 | #274 | Tragic 14.8% |
| Immigrants | West Indies | 0.0 /100 | #275 | Tragic 14.8% |
| Immigrants | Bahamas | 0.0 /100 | #276 | Tragic 14.8% |