Australian vs Macedonian Median Earnings
COMPARE
Australian
Macedonian
Median Earnings
Median Earnings Comparison
Australians
Macedonians
$52,294
MEDIAN EARNINGS
100.0/ 100
METRIC RATING
47th/ 347
METRIC RANK
$49,893
MEDIAN EARNINGS
99.2/ 100
METRIC RATING
91st/ 347
METRIC RANK
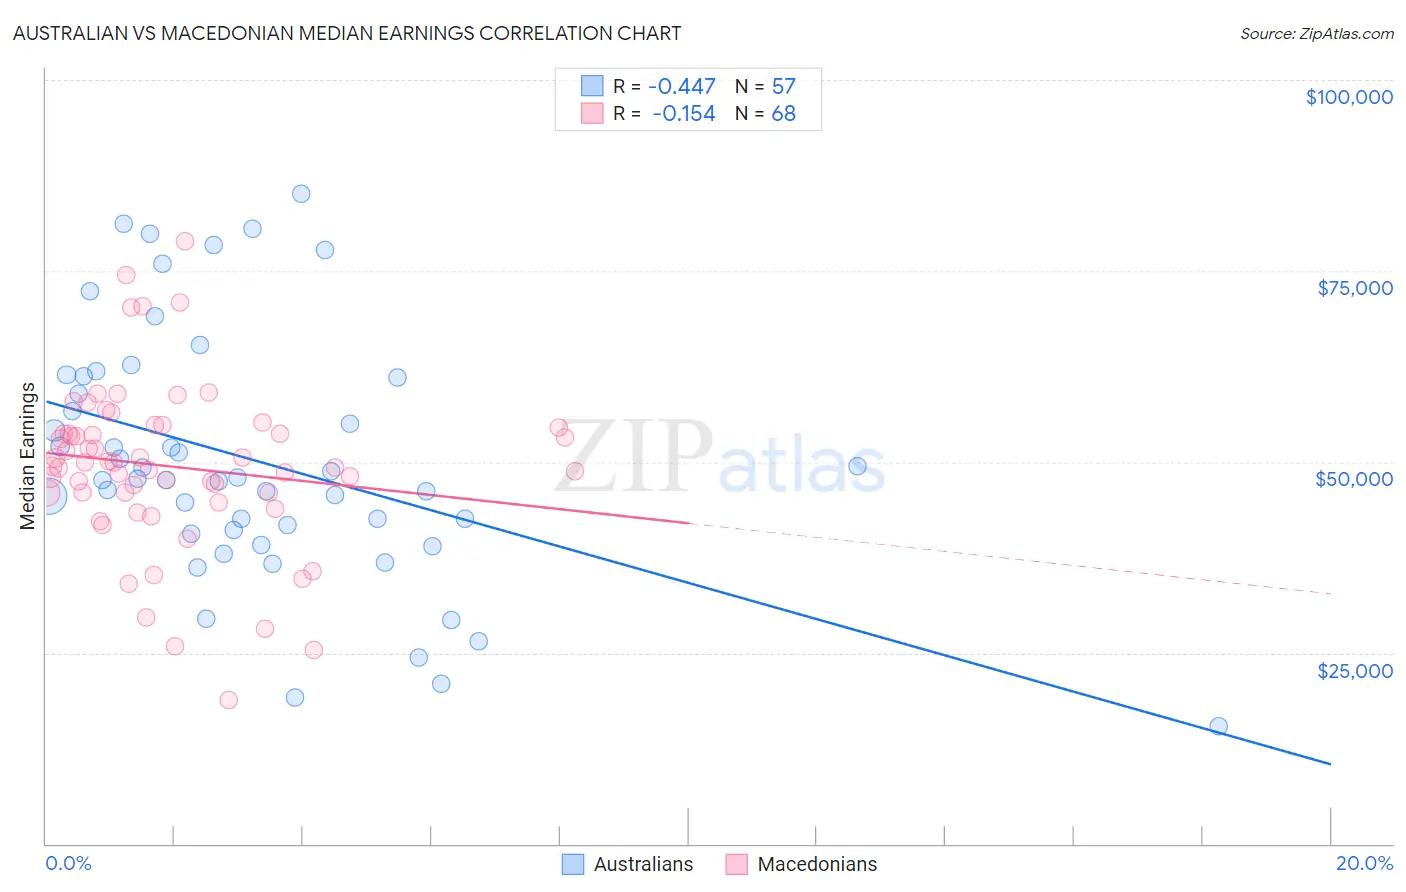
Australian vs Macedonian Median Earnings Correlation Chart
The statistical analysis conducted on geographies consisting of 224,158,339 people shows a moderate negative correlation between the proportion of Australians and median earnings in the United States with a correlation coefficient (R) of -0.447 and weighted average of $52,294. Similarly, the statistical analysis conducted on geographies consisting of 132,586,624 people shows a poor negative correlation between the proportion of Macedonians and median earnings in the United States with a correlation coefficient (R) of -0.154 and weighted average of $49,893, a difference of 4.8%.
Median Earnings Correlation Summary
| Measurement | Australian | Macedonian |
| Minimum | $15,451 | $18,816 |
| Maximum | $85,069 | $78,907 |
| Range | $69,618 | $60,091 |
| Mean | $50,151 | $49,392 |
| Median | $47,849 | $49,655 |
| Interquartile 25% (IQ1) | $40,819 | $45,965 |
| Interquartile 75% (IQ3) | $61,206 | $54,145 |
| Interquartile Range (IQR) | $20,387 | $8,180 |
| Standard Deviation (Sample) | $16,224 | $10,833 |
| Standard Deviation (Population) | $16,081 | $10,753 |
Similar Demographics by Median Earnings
Demographics Similar to Australians by Median Earnings
In terms of median earnings, the demographic groups most similar to Australians are Bhutanese ($52,297, a difference of 0.010%), Immigrants from Czechoslovakia ($52,361, a difference of 0.13%), Immigrants from Europe ($52,195, a difference of 0.19%), Immigrants from Malaysia ($52,514, a difference of 0.42%), and Bulgarian ($52,512, a difference of 0.42%).
| Demographics | Rating | Rank | Median Earnings |
| Israelis | 100.0 /100 | #40 | Exceptional $52,937 |
| Immigrants | Lithuania | 100.0 /100 | #41 | Exceptional $52,769 |
| Maltese | 100.0 /100 | #42 | Exceptional $52,526 |
| Immigrants | Malaysia | 100.0 /100 | #43 | Exceptional $52,514 |
| Bulgarians | 100.0 /100 | #44 | Exceptional $52,512 |
| Immigrants | Czechoslovakia | 100.0 /100 | #45 | Exceptional $52,361 |
| Bhutanese | 100.0 /100 | #46 | Exceptional $52,297 |
| Australians | 100.0 /100 | #47 | Exceptional $52,294 |
| Immigrants | Europe | 100.0 /100 | #48 | Exceptional $52,195 |
| Bolivians | 100.0 /100 | #49 | Exceptional $52,005 |
| Immigrants | South Africa | 100.0 /100 | #50 | Exceptional $51,850 |
| Immigrants | Austria | 99.9 /100 | #51 | Exceptional $51,826 |
| Estonians | 99.9 /100 | #52 | Exceptional $51,772 |
| Immigrants | Norway | 99.9 /100 | #53 | Exceptional $51,758 |
| Immigrants | Indonesia | 99.9 /100 | #54 | Exceptional $51,715 |
Demographics Similar to Macedonians by Median Earnings
In terms of median earnings, the demographic groups most similar to Macedonians are Italian ($49,915, a difference of 0.040%), Immigrants from Argentina ($49,841, a difference of 0.11%), Armenian ($49,804, a difference of 0.18%), Croatian ($49,724, a difference of 0.34%), and Immigrants from England ($49,722, a difference of 0.34%).
| Demographics | Rating | Rank | Median Earnings |
| Immigrants | Hungary | 99.5 /100 | #84 | Exceptional $50,227 |
| Immigrants | Kazakhstan | 99.5 /100 | #85 | Exceptional $50,225 |
| Immigrants | Canada | 99.5 /100 | #86 | Exceptional $50,192 |
| Immigrants | Uzbekistan | 99.5 /100 | #87 | Exceptional $50,151 |
| Albanians | 99.4 /100 | #88 | Exceptional $50,116 |
| Immigrants | North America | 99.4 /100 | #89 | Exceptional $50,108 |
| Italians | 99.3 /100 | #90 | Exceptional $49,915 |
| Macedonians | 99.2 /100 | #91 | Exceptional $49,893 |
| Immigrants | Argentina | 99.2 /100 | #92 | Exceptional $49,841 |
| Armenians | 99.1 /100 | #93 | Exceptional $49,804 |
| Croatians | 99.0 /100 | #94 | Exceptional $49,724 |
| Immigrants | England | 99.0 /100 | #95 | Exceptional $49,722 |
| Immigrants | Lebanon | 99.0 /100 | #96 | Exceptional $49,682 |
| Immigrants | North Macedonia | 98.9 /100 | #97 | Exceptional $49,658 |
| Immigrants | Northern Africa | 98.9 /100 | #98 | Exceptional $49,648 |