Australian vs Immigrants from Cameroon Median Earnings
COMPARE
Australian
Immigrants from Cameroon
Median Earnings
Median Earnings Comparison
Australians
Immigrants from Cameroon
$52,294
MEDIAN EARNINGS
100.0/ 100
METRIC RATING
47th/ 347
METRIC RANK
$46,329
MEDIAN EARNINGS
46.4/ 100
METRIC RATING
181st/ 347
METRIC RANK
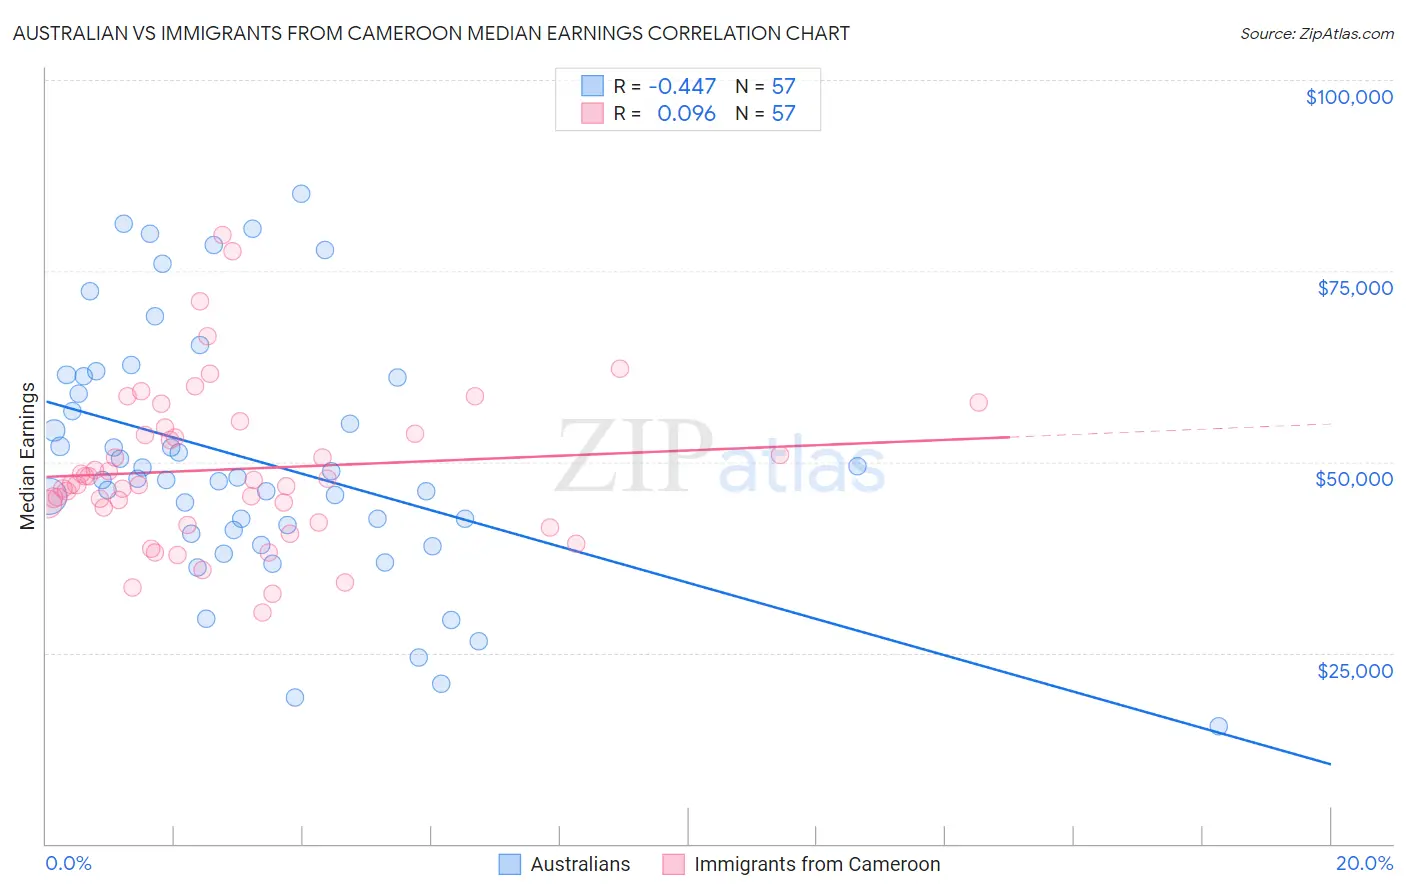
Australian vs Immigrants from Cameroon Median Earnings Correlation Chart
The statistical analysis conducted on geographies consisting of 224,158,339 people shows a moderate negative correlation between the proportion of Australians and median earnings in the United States with a correlation coefficient (R) of -0.447 and weighted average of $52,294. Similarly, the statistical analysis conducted on geographies consisting of 130,751,412 people shows a slight positive correlation between the proportion of Immigrants from Cameroon and median earnings in the United States with a correlation coefficient (R) of 0.096 and weighted average of $46,329, a difference of 12.9%.
Median Earnings Correlation Summary
| Measurement | Australian | Immigrants from Cameroon |
| Minimum | $15,451 | $30,304 |
| Maximum | $85,069 | $79,786 |
| Range | $69,618 | $49,482 |
| Mean | $50,151 | $49,022 |
| Median | $47,849 | $47,064 |
| Interquartile 25% (IQ1) | $40,819 | $43,064 |
| Interquartile 75% (IQ3) | $61,206 | $54,101 |
| Interquartile Range (IQR) | $20,387 | $11,037 |
| Standard Deviation (Sample) | $16,224 | $10,190 |
| Standard Deviation (Population) | $16,081 | $10,100 |
Similar Demographics by Median Earnings
Demographics Similar to Australians by Median Earnings
In terms of median earnings, the demographic groups most similar to Australians are Bhutanese ($52,297, a difference of 0.010%), Immigrants from Czechoslovakia ($52,361, a difference of 0.13%), Immigrants from Europe ($52,195, a difference of 0.19%), Immigrants from Malaysia ($52,514, a difference of 0.42%), and Bulgarian ($52,512, a difference of 0.42%).
| Demographics | Rating | Rank | Median Earnings |
| Israelis | 100.0 /100 | #40 | Exceptional $52,937 |
| Immigrants | Lithuania | 100.0 /100 | #41 | Exceptional $52,769 |
| Maltese | 100.0 /100 | #42 | Exceptional $52,526 |
| Immigrants | Malaysia | 100.0 /100 | #43 | Exceptional $52,514 |
| Bulgarians | 100.0 /100 | #44 | Exceptional $52,512 |
| Immigrants | Czechoslovakia | 100.0 /100 | #45 | Exceptional $52,361 |
| Bhutanese | 100.0 /100 | #46 | Exceptional $52,297 |
| Australians | 100.0 /100 | #47 | Exceptional $52,294 |
| Immigrants | Europe | 100.0 /100 | #48 | Exceptional $52,195 |
| Bolivians | 100.0 /100 | #49 | Exceptional $52,005 |
| Immigrants | South Africa | 100.0 /100 | #50 | Exceptional $51,850 |
| Immigrants | Austria | 99.9 /100 | #51 | Exceptional $51,826 |
| Estonians | 99.9 /100 | #52 | Exceptional $51,772 |
| Immigrants | Norway | 99.9 /100 | #53 | Exceptional $51,758 |
| Immigrants | Indonesia | 99.9 /100 | #54 | Exceptional $51,715 |
Demographics Similar to Immigrants from Cameroon by Median Earnings
In terms of median earnings, the demographic groups most similar to Immigrants from Cameroon are English ($46,334, a difference of 0.010%), Puget Sound Salish ($46,333, a difference of 0.010%), Swiss ($46,315, a difference of 0.030%), Colombian ($46,349, a difference of 0.040%), and French ($46,296, a difference of 0.070%).
| Demographics | Rating | Rank | Median Earnings |
| Scandinavians | 50.0 /100 | #174 | Average $46,433 |
| Basques | 48.8 /100 | #175 | Average $46,399 |
| Danes | 48.6 /100 | #176 | Average $46,392 |
| Belgians | 48.0 /100 | #177 | Average $46,375 |
| Colombians | 47.1 /100 | #178 | Average $46,349 |
| English | 46.5 /100 | #179 | Average $46,334 |
| Puget Sound Salish | 46.5 /100 | #180 | Average $46,333 |
| Immigrants | Cameroon | 46.4 /100 | #181 | Average $46,329 |
| Swiss | 45.9 /100 | #182 | Average $46,315 |
| French | 45.2 /100 | #183 | Average $46,296 |
| Immigrants | Kenya | 42.4 /100 | #184 | Average $46,214 |
| Uruguayans | 41.6 /100 | #185 | Average $46,190 |
| Vietnamese | 40.9 /100 | #186 | Average $46,172 |
| Iraqis | 39.9 /100 | #187 | Fair $46,140 |
| Immigrants | Armenia | 38.3 /100 | #188 | Fair $46,094 |