Australian vs Immigrants from Korea Median Earnings
COMPARE
Australian
Immigrants from Korea
Median Earnings
Median Earnings Comparison
Australians
Immigrants from Korea
$52,294
MEDIAN EARNINGS
100.0/ 100
METRIC RATING
47th/ 347
METRIC RANK
$54,530
MEDIAN EARNINGS
100.0/ 100
METRIC RATING
22nd/ 347
METRIC RANK
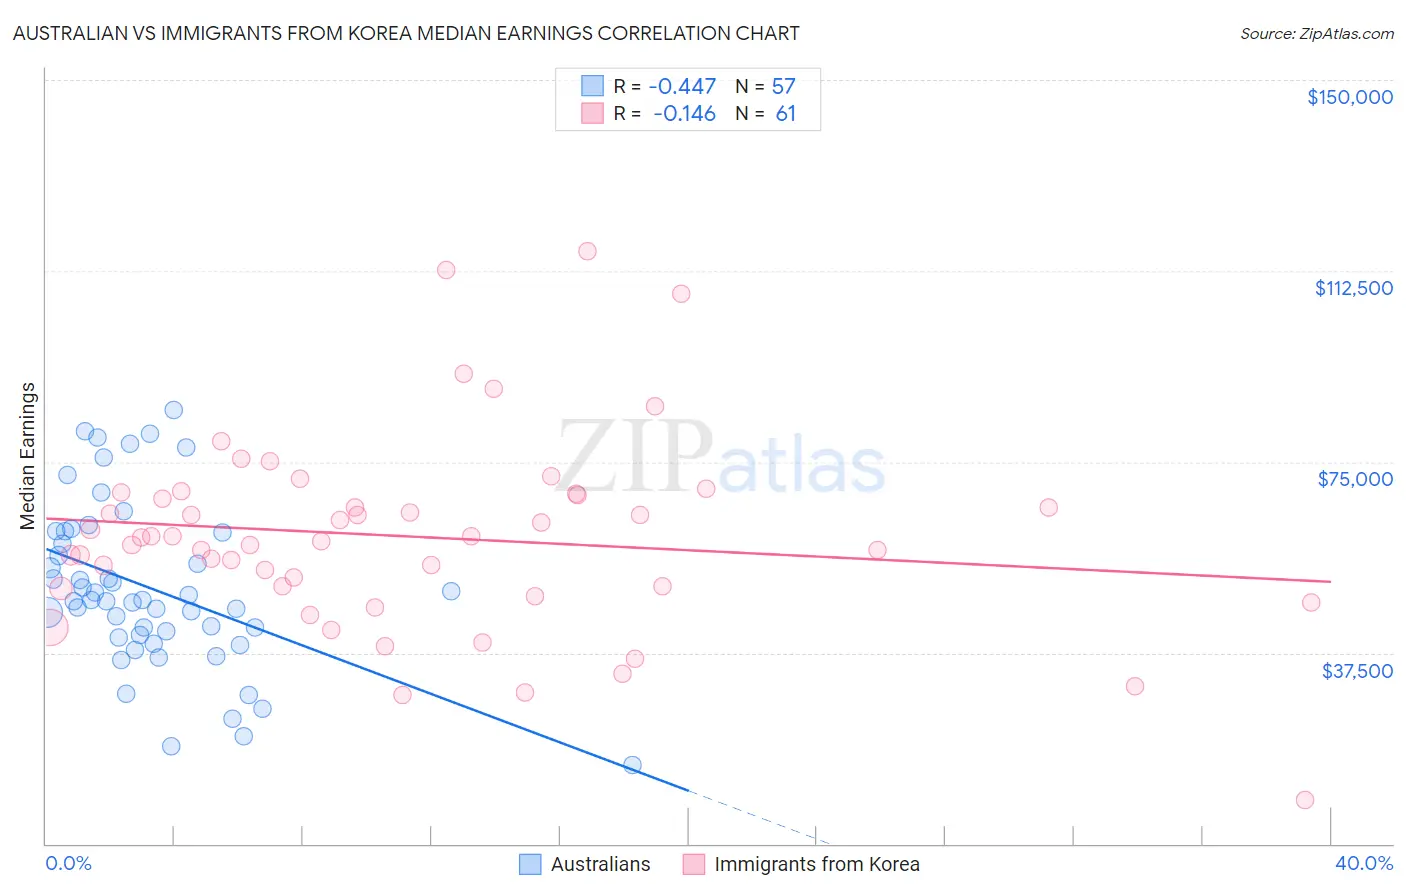
Australian vs Immigrants from Korea Median Earnings Correlation Chart
The statistical analysis conducted on geographies consisting of 224,158,339 people shows a moderate negative correlation between the proportion of Australians and median earnings in the United States with a correlation coefficient (R) of -0.447 and weighted average of $52,294. Similarly, the statistical analysis conducted on geographies consisting of 416,330,492 people shows a poor negative correlation between the proportion of Immigrants from Korea and median earnings in the United States with a correlation coefficient (R) of -0.146 and weighted average of $54,530, a difference of 4.3%.
Median Earnings Correlation Summary
| Measurement | Australian | Immigrants from Korea |
| Minimum | $15,451 | $8,707 |
| Maximum | $85,069 | $116,380 |
| Range | $69,618 | $107,673 |
| Mean | $50,151 | $60,321 |
| Median | $47,849 | $60,242 |
| Interquartile 25% (IQ1) | $40,819 | $50,376 |
| Interquartile 75% (IQ3) | $61,206 | $68,586 |
| Interquartile Range (IQR) | $20,387 | $18,211 |
| Standard Deviation (Sample) | $16,224 | $19,123 |
| Standard Deviation (Population) | $16,081 | $18,966 |
Similar Demographics by Median Earnings
Demographics Similar to Australians by Median Earnings
In terms of median earnings, the demographic groups most similar to Australians are Bhutanese ($52,297, a difference of 0.010%), Immigrants from Czechoslovakia ($52,361, a difference of 0.13%), Immigrants from Europe ($52,195, a difference of 0.19%), Immigrants from Malaysia ($52,514, a difference of 0.42%), and Bulgarian ($52,512, a difference of 0.42%).
| Demographics | Rating | Rank | Median Earnings |
| Israelis | 100.0 /100 | #40 | Exceptional $52,937 |
| Immigrants | Lithuania | 100.0 /100 | #41 | Exceptional $52,769 |
| Maltese | 100.0 /100 | #42 | Exceptional $52,526 |
| Immigrants | Malaysia | 100.0 /100 | #43 | Exceptional $52,514 |
| Bulgarians | 100.0 /100 | #44 | Exceptional $52,512 |
| Immigrants | Czechoslovakia | 100.0 /100 | #45 | Exceptional $52,361 |
| Bhutanese | 100.0 /100 | #46 | Exceptional $52,297 |
| Australians | 100.0 /100 | #47 | Exceptional $52,294 |
| Immigrants | Europe | 100.0 /100 | #48 | Exceptional $52,195 |
| Bolivians | 100.0 /100 | #49 | Exceptional $52,005 |
| Immigrants | South Africa | 100.0 /100 | #50 | Exceptional $51,850 |
| Immigrants | Austria | 99.9 /100 | #51 | Exceptional $51,826 |
| Estonians | 99.9 /100 | #52 | Exceptional $51,772 |
| Immigrants | Norway | 99.9 /100 | #53 | Exceptional $51,758 |
| Immigrants | Indonesia | 99.9 /100 | #54 | Exceptional $51,715 |
Demographics Similar to Immigrants from Korea by Median Earnings
In terms of median earnings, the demographic groups most similar to Immigrants from Korea are Burmese ($54,559, a difference of 0.050%), Immigrants from Sweden ($54,478, a difference of 0.10%), Cypriot ($54,589, a difference of 0.11%), Immigrants from Belgium ($54,679, a difference of 0.27%), and Soviet Union ($54,290, a difference of 0.44%).
| Demographics | Rating | Rank | Median Earnings |
| Indians (Asian) | 100.0 /100 | #15 | Exceptional $56,253 |
| Immigrants | Eastern Asia | 100.0 /100 | #16 | Exceptional $56,183 |
| Eastern Europeans | 100.0 /100 | #17 | Exceptional $55,084 |
| Immigrants | Japan | 100.0 /100 | #18 | Exceptional $54,938 |
| Immigrants | Belgium | 100.0 /100 | #19 | Exceptional $54,679 |
| Cypriots | 100.0 /100 | #20 | Exceptional $54,589 |
| Burmese | 100.0 /100 | #21 | Exceptional $54,559 |
| Immigrants | Korea | 100.0 /100 | #22 | Exceptional $54,530 |
| Immigrants | Sweden | 100.0 /100 | #23 | Exceptional $54,478 |
| Soviet Union | 100.0 /100 | #24 | Exceptional $54,290 |
| Turks | 100.0 /100 | #25 | Exceptional $53,919 |
| Immigrants | Northern Europe | 100.0 /100 | #26 | Exceptional $53,872 |
| Asians | 100.0 /100 | #27 | Exceptional $53,690 |
| Immigrants | France | 100.0 /100 | #28 | Exceptional $53,490 |
| Immigrants | Russia | 100.0 /100 | #29 | Exceptional $53,457 |