Carpatho Rusyn vs Macedonian Median Earnings
COMPARE
Carpatho Rusyn
Macedonian
Median Earnings
Median Earnings Comparison
Carpatho Rusyns
Macedonians
$48,617
MEDIAN EARNINGS
95.5/ 100
METRIC RATING
120th/ 347
METRIC RANK
$49,893
MEDIAN EARNINGS
99.2/ 100
METRIC RATING
91st/ 347
METRIC RANK
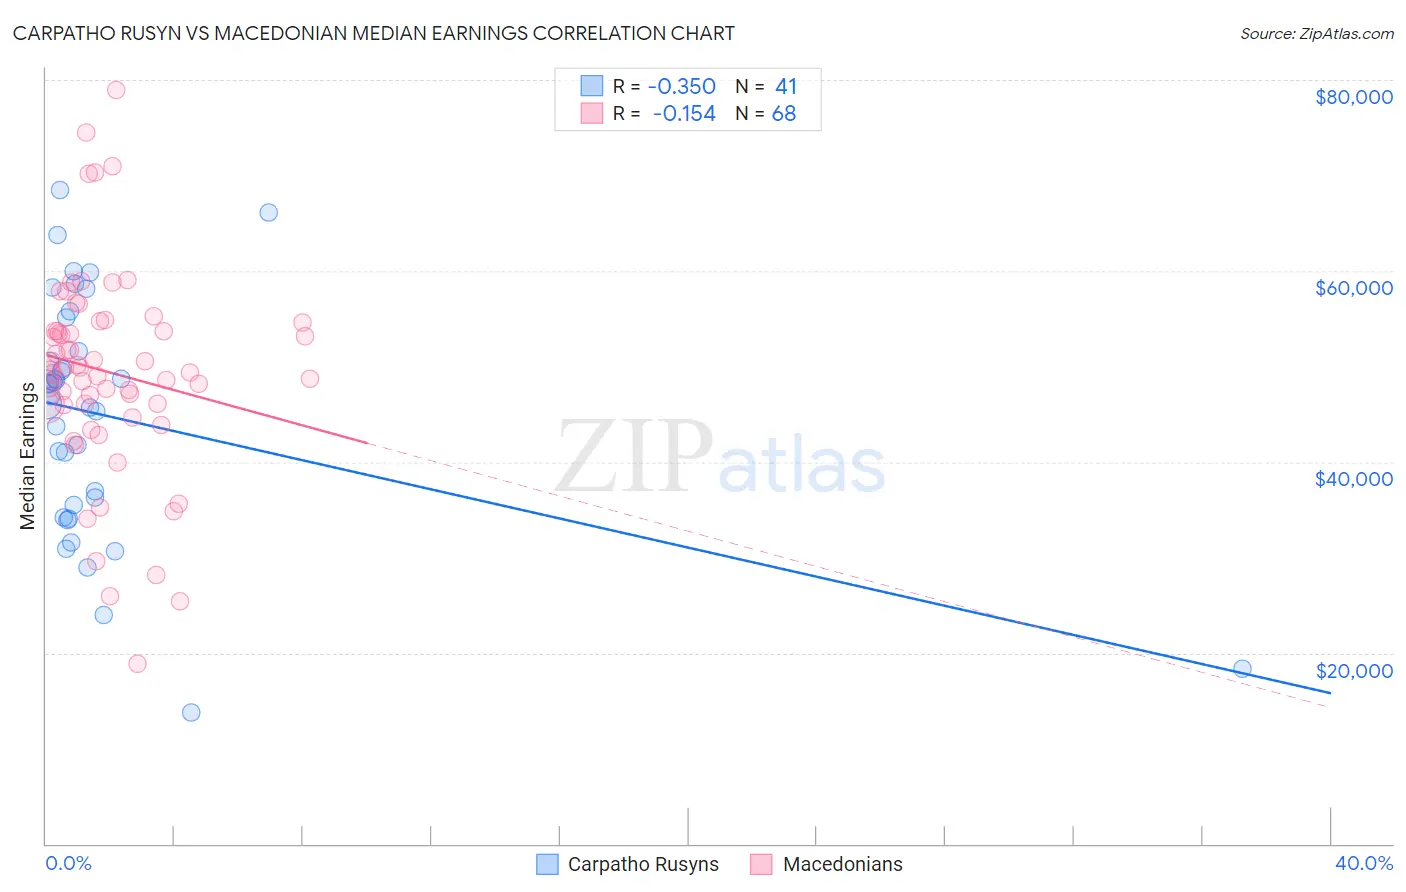
Carpatho Rusyn vs Macedonian Median Earnings Correlation Chart
The statistical analysis conducted on geographies consisting of 58,866,831 people shows a mild negative correlation between the proportion of Carpatho Rusyns and median earnings in the United States with a correlation coefficient (R) of -0.350 and weighted average of $48,617. Similarly, the statistical analysis conducted on geographies consisting of 132,586,624 people shows a poor negative correlation between the proportion of Macedonians and median earnings in the United States with a correlation coefficient (R) of -0.154 and weighted average of $49,893, a difference of 2.6%.
Median Earnings Correlation Summary
| Measurement | Carpatho Rusyn | Macedonian |
| Minimum | $13,750 | $18,816 |
| Maximum | $68,541 | $78,907 |
| Range | $54,791 | $60,091 |
| Mean | $44,793 | $49,392 |
| Median | $46,820 | $49,655 |
| Interquartile 25% (IQ1) | $34,839 | $45,965 |
| Interquartile 75% (IQ3) | $53,317 | $54,145 |
| Interquartile Range (IQR) | $18,479 | $8,180 |
| Standard Deviation (Sample) | $12,606 | $10,833 |
| Standard Deviation (Population) | $12,452 | $10,753 |
Similar Demographics by Median Earnings
Demographics Similar to Carpatho Rusyns by Median Earnings
In terms of median earnings, the demographic groups most similar to Carpatho Rusyns are Arab ($48,599, a difference of 0.040%), Polish ($48,659, a difference of 0.080%), Immigrants from Jordan ($48,673, a difference of 0.11%), Serbian ($48,677, a difference of 0.12%), and Korean ($48,727, a difference of 0.23%).
| Demographics | Rating | Rank | Median Earnings |
| Immigrants | Kuwait | 96.8 /100 | #113 | Exceptional $48,861 |
| Moroccans | 96.7 /100 | #114 | Exceptional $48,838 |
| Chinese | 96.7 /100 | #115 | Exceptional $48,836 |
| Koreans | 96.2 /100 | #116 | Exceptional $48,727 |
| Serbians | 95.9 /100 | #117 | Exceptional $48,677 |
| Immigrants | Jordan | 95.9 /100 | #118 | Exceptional $48,673 |
| Poles | 95.8 /100 | #119 | Exceptional $48,659 |
| Carpatho Rusyns | 95.5 /100 | #120 | Exceptional $48,617 |
| Arabs | 95.4 /100 | #121 | Exceptional $48,599 |
| Chileans | 94.8 /100 | #122 | Exceptional $48,504 |
| Immigrants | Syria | 93.9 /100 | #123 | Exceptional $48,375 |
| Brazilians | 93.7 /100 | #124 | Exceptional $48,356 |
| Immigrants | Fiji | 93.3 /100 | #125 | Exceptional $48,305 |
| Assyrians/Chaldeans/Syriacs | 93.3 /100 | #126 | Exceptional $48,304 |
| Sierra Leoneans | 93.1 /100 | #127 | Exceptional $48,286 |
Demographics Similar to Macedonians by Median Earnings
In terms of median earnings, the demographic groups most similar to Macedonians are Italian ($49,915, a difference of 0.040%), Immigrants from Argentina ($49,841, a difference of 0.11%), Armenian ($49,804, a difference of 0.18%), Croatian ($49,724, a difference of 0.34%), and Immigrants from England ($49,722, a difference of 0.34%).
| Demographics | Rating | Rank | Median Earnings |
| Immigrants | Hungary | 99.5 /100 | #84 | Exceptional $50,227 |
| Immigrants | Kazakhstan | 99.5 /100 | #85 | Exceptional $50,225 |
| Immigrants | Canada | 99.5 /100 | #86 | Exceptional $50,192 |
| Immigrants | Uzbekistan | 99.5 /100 | #87 | Exceptional $50,151 |
| Albanians | 99.4 /100 | #88 | Exceptional $50,116 |
| Immigrants | North America | 99.4 /100 | #89 | Exceptional $50,108 |
| Italians | 99.3 /100 | #90 | Exceptional $49,915 |
| Macedonians | 99.2 /100 | #91 | Exceptional $49,893 |
| Immigrants | Argentina | 99.2 /100 | #92 | Exceptional $49,841 |
| Armenians | 99.1 /100 | #93 | Exceptional $49,804 |
| Croatians | 99.0 /100 | #94 | Exceptional $49,724 |
| Immigrants | England | 99.0 /100 | #95 | Exceptional $49,722 |
| Immigrants | Lebanon | 99.0 /100 | #96 | Exceptional $49,682 |
| Immigrants | North Macedonia | 98.9 /100 | #97 | Exceptional $49,658 |
| Immigrants | Northern Africa | 98.9 /100 | #98 | Exceptional $49,648 |