Immigrants from Zimbabwe vs Macedonian Median Earnings
COMPARE
Immigrants from Zimbabwe
Macedonian
Median Earnings
Median Earnings Comparison
Immigrants from Zimbabwe
Macedonians
$48,913
MEDIAN EARNINGS
97.0/ 100
METRIC RATING
111th/ 347
METRIC RANK
$49,893
MEDIAN EARNINGS
99.2/ 100
METRIC RATING
91st/ 347
METRIC RANK
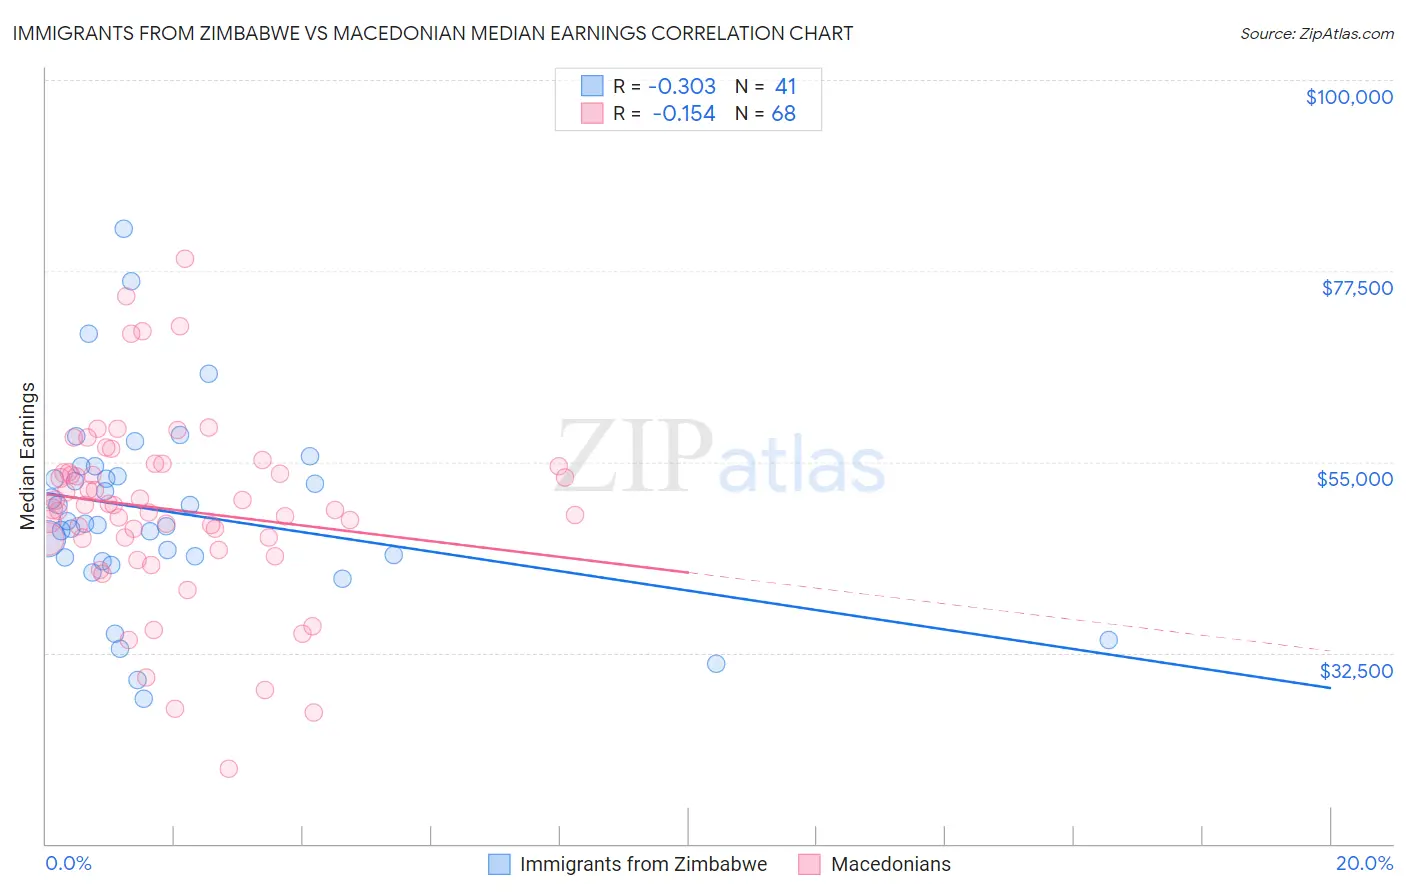
Immigrants from Zimbabwe vs Macedonian Median Earnings Correlation Chart
The statistical analysis conducted on geographies consisting of 117,811,113 people shows a mild negative correlation between the proportion of Immigrants from Zimbabwe and median earnings in the United States with a correlation coefficient (R) of -0.303 and weighted average of $48,913. Similarly, the statistical analysis conducted on geographies consisting of 132,586,624 people shows a poor negative correlation between the proportion of Macedonians and median earnings in the United States with a correlation coefficient (R) of -0.154 and weighted average of $49,893, a difference of 2.0%.
Median Earnings Correlation Summary
| Measurement | Immigrants from Zimbabwe | Macedonian |
| Minimum | $27,083 | $18,816 |
| Maximum | $82,500 | $78,907 |
| Range | $55,417 | $60,091 |
| Mean | $49,057 | $49,392 |
| Median | $47,680 | $49,655 |
| Interquartile 25% (IQ1) | $43,542 | $45,965 |
| Interquartile 75% (IQ3) | $53,907 | $54,145 |
| Interquartile Range (IQR) | $10,364 | $8,180 |
| Standard Deviation (Sample) | $11,395 | $10,833 |
| Standard Deviation (Population) | $11,255 | $10,753 |
Demographics Similar to Immigrants from Zimbabwe and Macedonians by Median Earnings
In terms of median earnings, the demographic groups most similar to Immigrants from Zimbabwe are Immigrants from Ethiopia ($48,924, a difference of 0.020%), Syrian ($48,934, a difference of 0.040%), Palestinian ($49,209, a difference of 0.60%), Immigrants from Morocco ($49,368, a difference of 0.93%), and Immigrants from Albania ($49,377, a difference of 0.95%). Similarly, the demographic groups most similar to Macedonians are Immigrants from Argentina ($49,841, a difference of 0.11%), Armenian ($49,804, a difference of 0.18%), Croatian ($49,724, a difference of 0.34%), Immigrants from England ($49,722, a difference of 0.34%), and Immigrants from Lebanon ($49,682, a difference of 0.43%).
| Demographics | Rating | Rank | Median Earnings |
| Macedonians | 99.2 /100 | #91 | Exceptional $49,893 |
| Immigrants | Argentina | 99.2 /100 | #92 | Exceptional $49,841 |
| Armenians | 99.1 /100 | #93 | Exceptional $49,804 |
| Croatians | 99.0 /100 | #94 | Exceptional $49,724 |
| Immigrants | England | 99.0 /100 | #95 | Exceptional $49,722 |
| Immigrants | Lebanon | 99.0 /100 | #96 | Exceptional $49,682 |
| Immigrants | North Macedonia | 98.9 /100 | #97 | Exceptional $49,658 |
| Immigrants | Northern Africa | 98.9 /100 | #98 | Exceptional $49,648 |
| Immigrants | Afghanistan | 98.9 /100 | #99 | Exceptional $49,645 |
| Immigrants | Poland | 98.9 /100 | #100 | Exceptional $49,633 |
| Jordanians | 98.9 /100 | #101 | Exceptional $49,632 |
| Ethiopians | 98.8 /100 | #102 | Exceptional $49,572 |
| Austrians | 98.7 /100 | #103 | Exceptional $49,501 |
| Immigrants | Brazil | 98.6 /100 | #104 | Exceptional $49,463 |
| Immigrants | Western Asia | 98.4 /100 | #105 | Exceptional $49,389 |
| Immigrants | Albania | 98.4 /100 | #106 | Exceptional $49,377 |
| Immigrants | Morocco | 98.4 /100 | #107 | Exceptional $49,368 |
| Palestinians | 98.0 /100 | #108 | Exceptional $49,209 |
| Syrians | 97.1 /100 | #109 | Exceptional $48,934 |
| Immigrants | Ethiopia | 97.1 /100 | #110 | Exceptional $48,924 |
| Immigrants | Zimbabwe | 97.0 /100 | #111 | Exceptional $48,913 |