Assyrian/Chaldean/Syriac vs Indonesian Unemployment Among Youth under 25 years

COMPARE

Assyrian/Chaldean/Syriac
Race
Ancestry
AfghanAfricanAlaska NativeAlaskan AthabascanAlbanianAleutAlsatianAmericanApacheArabArapahoArgentineanArmenianAssyrian/Chaldean/SyriacAustralianAustrianBahamianBangladeshiBarbadianBasqueBelgianBelizeanBermudanBhutaneseBlackfeetBolivianBrazilianBritishBritish West IndianBulgarianBurmeseCajunCambodianCanadianCape VerdeanCarpatho RusynCelticCentral AmericanCentral American IndianCherokeeCheyenneChickasawChileanChineseChippewaChoctawColombianColvilleComancheCosta RicanCreeCreekCroatianCrowCubanCypriotCzechCzechoslovakianDanishDelawareDominicanDutchDutch West IndianEastern EuropeanEcuadorianEgyptianEnglishEstonianEthiopianEuropeanFijianFilipinoFinnishFrenchFrench American IndianFrench CanadianGermanGerman RussianGhanaianGreekGuamanian/ChamorroGuatemalanGuyaneseHaitianHmongHonduranHopiHoumaHungarianIcelanderIndian (Asian)InupiatIranianIraqiIrishIroquoisIsraeliItalianJamaicanJapaneseJordanianKenyanKiowaKoreanLaotianLatvianLebaneseLiberianLithuanianLumbeeLuxembourgerMacedonianMalaysianMalteseMarshalleseMenomineeMexicanMexican American IndianMongolianMoroccanNative HawaiianNavajoNepaleseNew ZealanderNicaraguanNigerianNorthern EuropeanNorwegianOkinawanOsageOttawaPaiutePakistaniPalestinianPanamanianParaguayanPennsylvania GermanPeruvianPimaPolishPortuguesePotawatomiPuebloPuerto RicanPuget Sound SalishRomanianRussianSalvadoranSamoanScandinavianScotch-IrishScottishSeminoleSenegaleseSerbianShoshoneSierra LeoneanSiouxSlavicSlovakSloveneSomaliSouth AfricanSouth AmericanSouth American IndianSoviet UnionSpaniardSpanishSpanish AmericanSpanish American IndianSri LankanSubsaharan AfricanSudaneseSwedishSwissSyrianTaiwaneseThaiTlingit-HaidaTohono O'OdhamTonganTrinidadian and TobagonianTsimshianTurkishU.S. Virgin IslanderUgandanUkrainianUruguayanUteVenezuelanVietnameseWelshWest IndianYakamaYaquiYugoslavianYumanYup'ikZimbabwean
Immigration
NonimmigrantsImmigrantsAfghanistanAfricaAlbaniaArgentinaArmeniaAsiaAustraliaAustriaBahamasBangladeshBarbadosBelarusBelgiumBelizeBoliviaBosnia and HerzegovinaBrazilBulgariaBurma/MyanmarCabo VerdeCambodiaCameroonCanadaCaribbeanCentral AmericaChileChinaColombiaCongoCosta RicaCroatiaCubaCzechoslovakiaDenmarkDominicaDominican RepublicEastern AfricaEastern AsiaEastern EuropeEcuadorEgyptEl SalvadorEnglandEritreaEthiopiaEuropeFijiFranceGermanyGhanaGreeceGrenadaGuatemalaGuyanaHaitiHondurasHong KongHungaryIndiaIndonesiaIranIraqIrelandIsraelItalyJamaicaJapanJordanKazakhstanKenyaKoreaKuwaitLaosLatin AmericaLatviaLebanonLiberiaLithuaniaMalaysiaMexicoMicronesiaMiddle AfricaMoldovaMoroccoNepalNetherlandsNicaraguaNigeriaNorth AmericaNorth MacedoniaNorthern AfricaNorthern EuropeNorwayOceaniaPakistanPanamaPeruPhilippinesPolandPortugalRomaniaRussiaSaudi ArabiaScotlandSenegalSerbiaSierra LeoneSingaporeSomaliaSouth AfricaSouth AmericaSouth Central AsiaSouth Eastern AsiaSouthern EuropeSpainSri LankaSt. Vincent and the GrenadinesSudanSwedenSwitzerlandSyriaTaiwanThailandTrinidad and TobagoTurkeyUgandaUkraineUruguayUzbekistanVenezuelaVietnamWest IndiesWestern AfricaWestern AsiaWestern EuropeYemenZaireZimbabweAzores
Indonesian
Race
Ancestry
AfghanAfricanAlaska NativeAlaskan AthabascanAlbanianAleutAlsatianAmericanApacheArabArapahoArgentineanArmenianAustralianAustrianBahamianBangladeshiBarbadianBasqueBelgianBelizeanBermudanBhutaneseBlackfeetBolivianBrazilianBritishBritish West IndianBulgarianBurmeseCajunCambodianCanadianCape VerdeanCarpatho RusynCelticCentral AmericanCentral American IndianCherokeeCheyenneChickasawChileanChineseChippewaChoctawColombianColvilleComancheCosta RicanCreeCreekCroatianCrowCubanCypriotCzechCzechoslovakianDanishDelawareDominicanDutchDutch West IndianEastern EuropeanEcuadorianEgyptianEnglishEstonianEthiopianEuropeanFijianFilipinoFinnishFrenchFrench American IndianFrench CanadianGermanGerman RussianGhanaianGreekGuamanian/ChamorroGuatemalanGuyaneseHaitianHmongHonduranHopiHoumaHungarianIcelanderIndian (Asian)IndonesianInupiatIranianIraqiIrishIroquoisIsraeliItalianJamaicanJapaneseJordanianKenyanKiowaKoreanLaotianLatvianLebaneseLiberianLithuanianLumbeeLuxembourgerMacedonianMalaysianMalteseMarshalleseMenomineeMexicanMexican American IndianMongolianMoroccanNative HawaiianNavajoNepaleseNew ZealanderNicaraguanNigerianNorthern EuropeanNorwegianOkinawanOsageOttawaPaiutePakistaniPalestinianPanamanianParaguayanPennsylvania GermanPeruvianPimaPolishPortuguesePotawatomiPuebloPuerto RicanPuget Sound SalishRomanianRussianSalvadoranSamoanScandinavianScotch-IrishScottishSeminoleSenegaleseSerbianShoshoneSierra LeoneanSiouxSlavicSlovakSloveneSomaliSouth AfricanSouth AmericanSouth American IndianSoviet UnionSpaniardSpanishSpanish AmericanSpanish American IndianSri LankanSubsaharan AfricanSudaneseSwedishSwissSyrianTaiwaneseThaiTlingit-HaidaTohono O'OdhamTonganTrinidadian and TobagonianTsimshianTurkishU.S. Virgin IslanderUgandanUkrainianUruguayanUteVenezuelanVietnameseWelshWest IndianYakamaYaquiYugoslavianYumanYup'ikZimbabwean
Immigration
NonimmigrantsImmigrantsAfghanistanAfricaAlbaniaArgentinaArmeniaAsiaAustraliaAustriaBahamasBangladeshBarbadosBelarusBelgiumBelizeBoliviaBosnia and HerzegovinaBrazilBulgariaBurma/MyanmarCabo VerdeCambodiaCameroonCanadaCaribbeanCentral AmericaChileChinaColombiaCongoCosta RicaCroatiaCubaCzechoslovakiaDenmarkDominicaDominican RepublicEastern AfricaEastern AsiaEastern EuropeEcuadorEgyptEl SalvadorEnglandEritreaEthiopiaEuropeFijiFranceGermanyGhanaGreeceGrenadaGuatemalaGuyanaHaitiHondurasHong KongHungaryIndiaIndonesiaIranIraqIrelandIsraelItalyJamaicaJapanJordanKazakhstanKenyaKoreaKuwaitLaosLatin AmericaLatviaLebanonLiberiaLithuaniaMalaysiaMexicoMicronesiaMiddle AfricaMoldovaMoroccoNepalNetherlandsNicaraguaNigeriaNorth AmericaNorth MacedoniaNorthern AfricaNorthern EuropeNorwayOceaniaPakistanPanamaPeruPhilippinesPolandPortugalRomaniaRussiaSaudi ArabiaScotlandSenegalSerbiaSierra LeoneSingaporeSomaliaSouth AfricaSouth AmericaSouth Central AsiaSouth Eastern AsiaSouthern EuropeSpainSri LankaSt. Vincent and the GrenadinesSudanSwedenSwitzerlandSyriaTaiwanThailandTrinidad and TobagoTurkeyUgandaUkraineUruguayUzbekistanVenezuelaVietnamWest IndiesWestern AfricaWestern AsiaWestern EuropeYemenZaireZimbabweAzores
Unemployment Among Youth under 25 years
Income
Poverty
Unemployment
Labor Participation
Family Structure
Vehicle Availability
Education Level
Disability

Unemployment Among Youth under 25 years Comparison

Assyrians/Chaldeans/Syriacs

Indonesians

Tragic
Exceptional
11.9%
UNEMPLOYMENT AMONG YOUTH UNDER 25 YEARS
9.8/ 100
METRIC RATING
210th/ 347
METRIC RANK
10.6%
UNEMPLOYMENT AMONG YOUTH UNDER 25 YEARS
100.0/ 100
METRIC RATING
13th/ 347
METRIC RANK

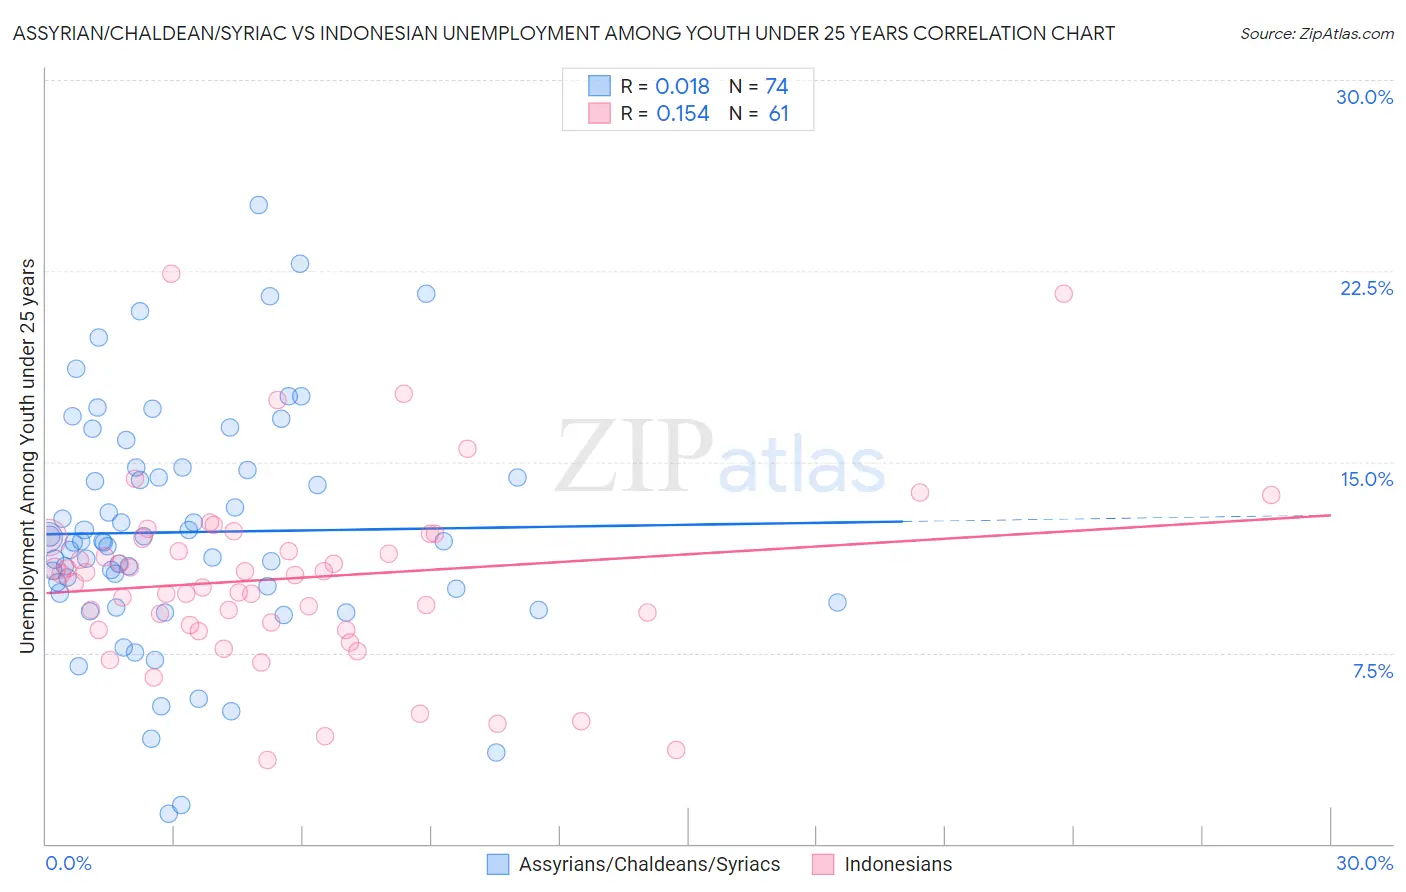
Assyrian/Chaldean/Syriac vs Indonesian Unemployment Among Youth under 25 years Correlation Chart

The statistical analysis conducted on geographies consisting of 109,923,358 people shows no correlation between the proportion of Assyrians/Chaldeans/Syriacs and unemployment rate among youth under the age of 25 in the United States with a correlation coefficient (R) of 0.018 and weighted average of 11.9%. Similarly, the statistical analysis conducted on geographies consisting of 162,194,941 people shows a poor positive correlation between the proportion of Indonesians and unemployment rate among youth under the age of 25 in the United States with a correlation coefficient (R) of 0.154 and weighted average of 10.6%, a difference of 12.4%.
Assyrian/Chaldean/Syriac vs Indonesian Unemployment Among Youth under 25 years

Unemployment Among Youth under 25 years Correlation Summary

MeasurementAssyrian/Chaldean/SyriacIndonesian
Minimum1.2%3.3%
Maximum25.1%22.4%
Range23.9%19.1%
Mean12.2%10.4%
Median11.9%10.5%
Interquartile 25% (IQ1)9.8%8.5%
Interquartile 75% (IQ3)14.7%12.0%
Interquartile Range (IQR)4.9%3.5%
Standard Deviation (Sample)4.6%3.6%
Standard Deviation (Population)4.6%3.6%

Similar Demographics by Unemployment Among Youth under 25 years

Demographics Similar to Assyrians/Chaldeans/Syriacs by Unemployment Among Youth under 25 years

In terms of unemployment among youth under 25 years, the demographic groups most similar to Assyrians/Chaldeans/Syriacs are Immigrants from Philippines (11.9%, a difference of 0.070%), Colombian (11.9%, a difference of 0.090%), Immigrants from Lebanon (11.8%, a difference of 0.15%), South American (11.9%, a difference of 0.16%), and Costa Rican (11.9%, a difference of 0.21%).
DemographicsRating | RankUnemployment Among Youth under 25 years
Immigrants | Peru
15.3
/100
|
#203
Poor
11.8%
Immigrants | Costa Rica
15.2
/100
|
#204
Poor
11.8%
Peruvians
14.0
/100
|
#205
Poor
11.8%
Immigrants | Pakistan
12.6
/100
|
#206
Poor
11.8%
Immigrants | Southern Europe
12.3
/100
|
#207
Poor
11.8%
Comanche
12.1
/100
|
#208
Poor
11.8%
Immigrants | Lebanon
11.3
/100
|
#209
Poor
11.8%
Assyrians/Chaldeans/Syriacs
9.8
/100
|
#210
Tragic
11.9%
Immigrants | Philippines
9.2
/100
|
#211
Tragic
11.9%
Colombians
9.1
/100
|
#212
Tragic
11.9%
South Americans
8.5
/100
|
#213
Tragic
11.9%
Costa Ricans
8.2
/100
|
#214
Tragic
11.9%
Samoans
7.4
/100
|
#215
Tragic
11.9%
Guamanians/Chamorros
7.0
/100
|
#216
Tragic
11.9%
Yaqui
6.9
/100
|
#217
Tragic
11.9%

Demographics Similar to Indonesians by Unemployment Among Youth under 25 years

In terms of unemployment among youth under 25 years, the demographic groups most similar to Indonesians are Cuban (10.6%, a difference of 0.020%), Immigrants from Sudan (10.5%, a difference of 0.12%), Sudanese (10.6%, a difference of 0.13%), Venezuelan (10.6%, a difference of 0.14%), and Menominee (10.6%, a difference of 0.19%).
DemographicsRating | RankUnemployment Among Youth under 25 years
Danes
100.0
/100
|
#6
Exceptional
10.3%
Swedes
100.0
/100
|
#7
Exceptional
10.4%
Immigrants | Venezuela
100.0
/100
|
#8
Exceptional
10.5%
Germans
100.0
/100
|
#9
Exceptional
10.5%
Immigrants | Somalia
100.0
/100
|
#10
Exceptional
10.5%
Scandinavians
100.0
/100
|
#11
Exceptional
10.5%
Immigrants | Sudan
100.0
/100
|
#12
Exceptional
10.5%
Indonesians
100.0
/100
|
#13
Exceptional
10.6%
Cubans
100.0
/100
|
#14
Exceptional
10.6%
Sudanese
100.0
/100
|
#15
Exceptional
10.6%
Venezuelans
100.0
/100
|
#16
Exceptional
10.6%
Menominee
100.0
/100
|
#17
Exceptional
10.6%
Swiss
100.0
/100
|
#18
Exceptional
10.6%
Immigrants | Burma/Myanmar
100.0
/100
|
#19
Exceptional
10.6%
Dutch
100.0
/100
|
#20
Exceptional
10.6%