Crow vs Immigrants from Eastern Africa Median Family Income
COMPARE
Crow
Immigrants from Eastern Africa
Median Family Income
Median Family Income Comparison
Crow
Immigrants from Eastern Africa
$76,605
MEDIAN FAMILY INCOME
0.0/ 100
METRIC RATING
342nd/ 347
METRIC RANK
$102,451
MEDIAN FAMILY INCOME
47.1/ 100
METRIC RATING
175th/ 347
METRIC RANK
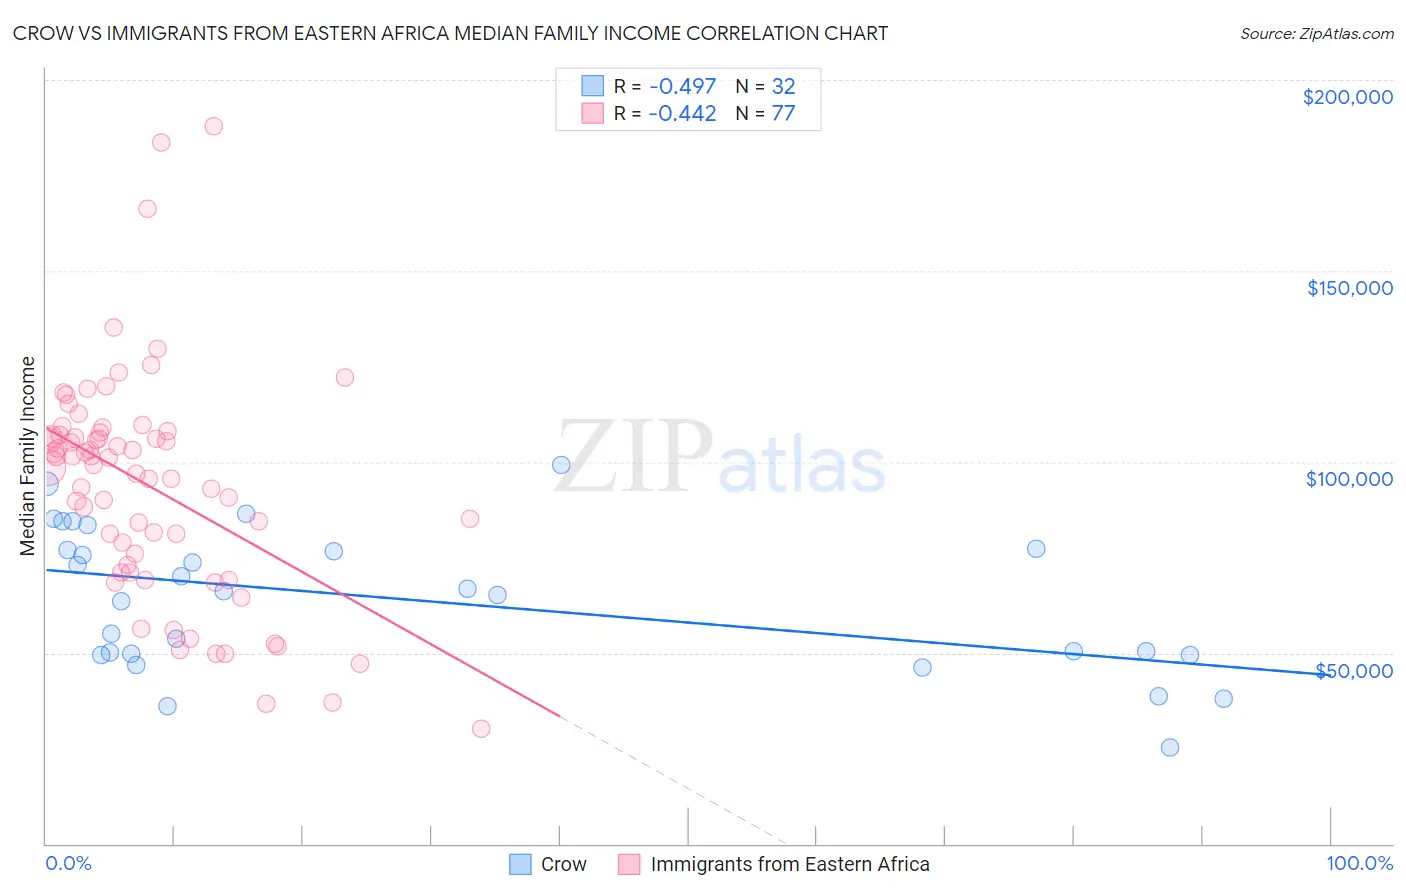
Crow vs Immigrants from Eastern Africa Median Family Income Correlation Chart
The statistical analysis conducted on geographies consisting of 59,195,543 people shows a moderate negative correlation between the proportion of Crow and median family income in the United States with a correlation coefficient (R) of -0.497 and weighted average of $76,605. Similarly, the statistical analysis conducted on geographies consisting of 354,805,172 people shows a moderate negative correlation between the proportion of Immigrants from Eastern Africa and median family income in the United States with a correlation coefficient (R) of -0.442 and weighted average of $102,451, a difference of 33.7%.
Median Family Income Correlation Summary
| Measurement | Crow | Immigrants from Eastern Africa |
| Minimum | $25,179 | $29,978 |
| Maximum | $99,219 | $188,047 |
| Range | $74,040 | $158,069 |
| Mean | $63,807 | $93,590 |
| Median | $65,747 | $99,122 |
| Interquartile 25% (IQ1) | $49,683 | $71,998 |
| Interquartile 75% (IQ3) | $77,098 | $107,333 |
| Interquartile Range (IQR) | $27,414 | $35,335 |
| Standard Deviation (Sample) | $18,632 | $29,714 |
| Standard Deviation (Population) | $18,339 | $29,520 |
Similar Demographics by Median Family Income
Demographics Similar to Crow by Median Family Income
In terms of median family income, the demographic groups most similar to Crow are Pueblo ($76,880, a difference of 0.36%), Houma ($76,188, a difference of 0.55%), Hopi ($77,188, a difference of 0.76%), Pima ($77,431, a difference of 1.1%), and Immigrants from Yemen ($77,457, a difference of 1.1%).
| Demographics | Rating | Rank | Median Family Income |
| Kiowa | 0.0 /100 | #333 | Tragic $80,885 |
| Menominee | 0.0 /100 | #334 | Tragic $79,563 |
| Yup'ik | 0.0 /100 | #335 | Tragic $79,290 |
| Immigrants | Cuba | 0.0 /100 | #336 | Tragic $78,249 |
| Yuman | 0.0 /100 | #337 | Tragic $78,055 |
| Immigrants | Yemen | 0.0 /100 | #338 | Tragic $77,457 |
| Pima | 0.0 /100 | #339 | Tragic $77,431 |
| Hopi | 0.0 /100 | #340 | Tragic $77,188 |
| Pueblo | 0.0 /100 | #341 | Tragic $76,880 |
| Crow | 0.0 /100 | #342 | Tragic $76,605 |
| Houma | 0.0 /100 | #343 | Tragic $76,188 |
| Tohono O'odham | 0.0 /100 | #344 | Tragic $72,193 |
| Navajo | 0.0 /100 | #345 | Tragic $70,989 |
| Puerto Ricans | 0.0 /100 | #346 | Tragic $70,423 |
| Lumbee | 0.0 /100 | #347 | Tragic $68,679 |
Demographics Similar to Immigrants from Eastern Africa by Median Family Income
In terms of median family income, the demographic groups most similar to Immigrants from Eastern Africa are French ($102,368, a difference of 0.080%), German ($102,254, a difference of 0.19%), Finnish ($102,676, a difference of 0.22%), Welsh ($102,151, a difference of 0.29%), and Belgian ($102,788, a difference of 0.33%).
| Demographics | Rating | Rank | Median Family Income |
| Immigrants | Peru | 60.8 /100 | #168 | Good $103,534 |
| Czechoslovakians | 57.6 /100 | #169 | Average $103,273 |
| Immigrants | Uzbekistan | 56.6 /100 | #170 | Average $103,197 |
| Alsatians | 54.3 /100 | #171 | Average $103,010 |
| Immigrants | Eritrea | 51.9 /100 | #172 | Average $102,823 |
| Belgians | 51.4 /100 | #173 | Average $102,788 |
| Finns | 50.0 /100 | #174 | Average $102,676 |
| Immigrants | Eastern Africa | 47.1 /100 | #175 | Average $102,451 |
| French | 46.1 /100 | #176 | Average $102,368 |
| Germans | 44.6 /100 | #177 | Average $102,254 |
| Welsh | 43.3 /100 | #178 | Average $102,151 |
| South Americans | 39.7 /100 | #179 | Fair $101,856 |
| French Canadians | 37.0 /100 | #180 | Fair $101,634 |
| Spaniards | 36.8 /100 | #181 | Fair $101,617 |
| Tsimshian | 35.9 /100 | #182 | Fair $101,543 |