Finnish vs Czechoslovakian Householder Income Over 65 years
COMPARE
Finnish
Czechoslovakian
Householder Income Over 65 years
Householder Income Over 65 years Comparison
Finns
Czechoslovakians
$59,535
HOUSEHOLDER INCOME OVER 65 YEARS
18.2/ 100
METRIC RATING
202nd/ 347
METRIC RANK
$60,581
HOUSEHOLDER INCOME OVER 65 YEARS
40.0/ 100
METRIC RATING
182nd/ 347
METRIC RANK
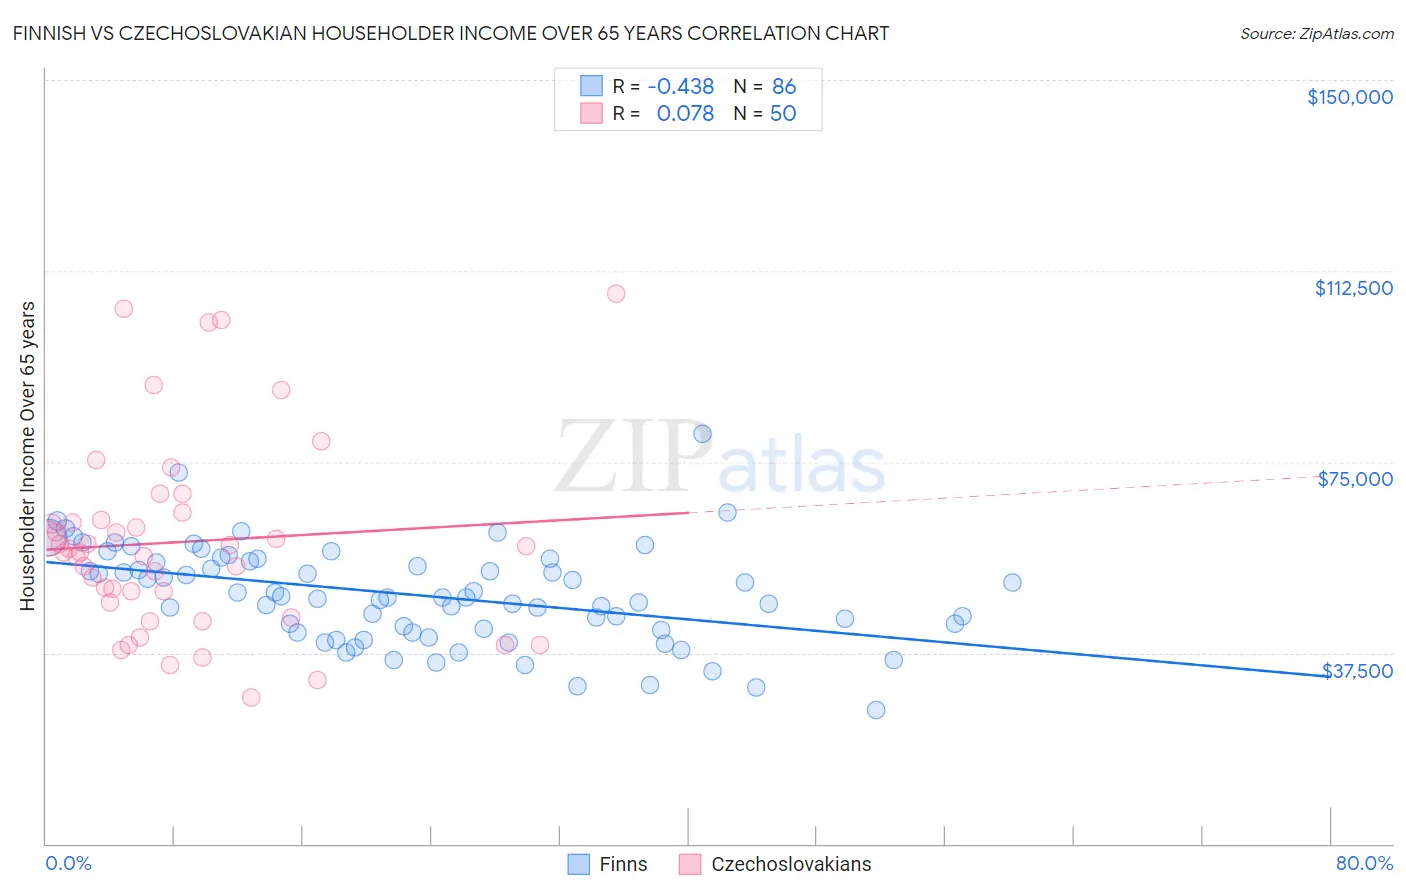
Finnish vs Czechoslovakian Householder Income Over 65 years Correlation Chart
The statistical analysis conducted on geographies consisting of 403,493,749 people shows a moderate negative correlation between the proportion of Finns and household income with householder over the age of 65 in the United States with a correlation coefficient (R) of -0.438 and weighted average of $59,535. Similarly, the statistical analysis conducted on geographies consisting of 367,841,442 people shows a slight positive correlation between the proportion of Czechoslovakians and household income with householder over the age of 65 in the United States with a correlation coefficient (R) of 0.078 and weighted average of $60,581, a difference of 1.8%.
Householder Income Over 65 years Correlation Summary
| Measurement | Finnish | Czechoslovakian |
| Minimum | $26,250 | $28,750 |
| Maximum | $80,493 | $108,125 |
| Range | $54,243 | $79,375 |
| Mean | $48,855 | $59,283 |
| Median | $48,360 | $57,534 |
| Interquartile 25% (IQ1) | $41,947 | $47,364 |
| Interquartile 75% (IQ3) | $55,469 | $63,539 |
| Interquartile Range (IQR) | $13,523 | $16,175 |
| Standard Deviation (Sample) | $9,627 | $18,822 |
| Standard Deviation (Population) | $9,571 | $18,633 |
Demographics Similar to Finns and Czechoslovakians by Householder Income Over 65 years
In terms of householder income over 65 years, the demographic groups most similar to Finns are Dutch ($59,539, a difference of 0.010%), Immigrants ($59,656, a difference of 0.20%), French ($59,656, a difference of 0.20%), Moroccan ($59,683, a difference of 0.25%), and Immigrants from Kenya ($59,710, a difference of 0.29%). Similarly, the demographic groups most similar to Czechoslovakians are Kenyan ($60,514, a difference of 0.11%), Iraqi ($60,466, a difference of 0.19%), Albanian ($60,249, a difference of 0.55%), Slovene ($60,241, a difference of 0.57%), and Immigrants from Thailand ($60,217, a difference of 0.60%).
| Demographics | Rating | Rank | Householder Income Over 65 years |
| Czechoslovakians | 40.0 /100 | #182 | Average $60,581 |
| Kenyans | 38.4 /100 | #183 | Fair $60,514 |
| Iraqis | 37.2 /100 | #184 | Fair $60,466 |
| Albanians | 32.0 /100 | #185 | Fair $60,249 |
| Slovenes | 31.8 /100 | #186 | Fair $60,241 |
| Immigrants | Thailand | 31.3 /100 | #187 | Fair $60,217 |
| Immigrants | Eritrea | 28.6 /100 | #188 | Fair $60,096 |
| Ghanaians | 27.5 /100 | #189 | Fair $60,043 |
| Puget Sound Salish | 25.3 /100 | #190 | Fair $59,934 |
| Belgians | 24.9 /100 | #191 | Fair $59,915 |
| South Americans | 23.8 /100 | #192 | Fair $59,854 |
| Immigrants | Costa Rica | 23.6 /100 | #193 | Fair $59,848 |
| Immigrants | Africa | 23.4 /100 | #194 | Fair $59,837 |
| Immigrants | Iraq | 23.2 /100 | #195 | Fair $59,824 |
| Germans | 21.5 /100 | #196 | Fair $59,730 |
| Immigrants | Kenya | 21.1 /100 | #197 | Fair $59,710 |
| Moroccans | 20.7 /100 | #198 | Fair $59,683 |
| Immigrants | Immigrants | 20.2 /100 | #199 | Fair $59,656 |
| French | 20.2 /100 | #200 | Fair $59,656 |
| Dutch | 18.3 /100 | #201 | Poor $59,539 |
| Finns | 18.2 /100 | #202 | Poor $59,535 |