Taiwanese vs Alsatian Householder Income Under 25 years
COMPARE
Taiwanese
Alsatian
Householder Income Under 25 years
Householder Income Under 25 years Comparison
Taiwanese
Alsatians
$49,804
HOUSEHOLDER INCOME UNDER 25 YEARS
0.3/ 100
METRIC RATING
271st/ 347
METRIC RANK
$49,267
HOUSEHOLDER INCOME UNDER 25 YEARS
0.1/ 100
METRIC RATING
282nd/ 347
METRIC RANK
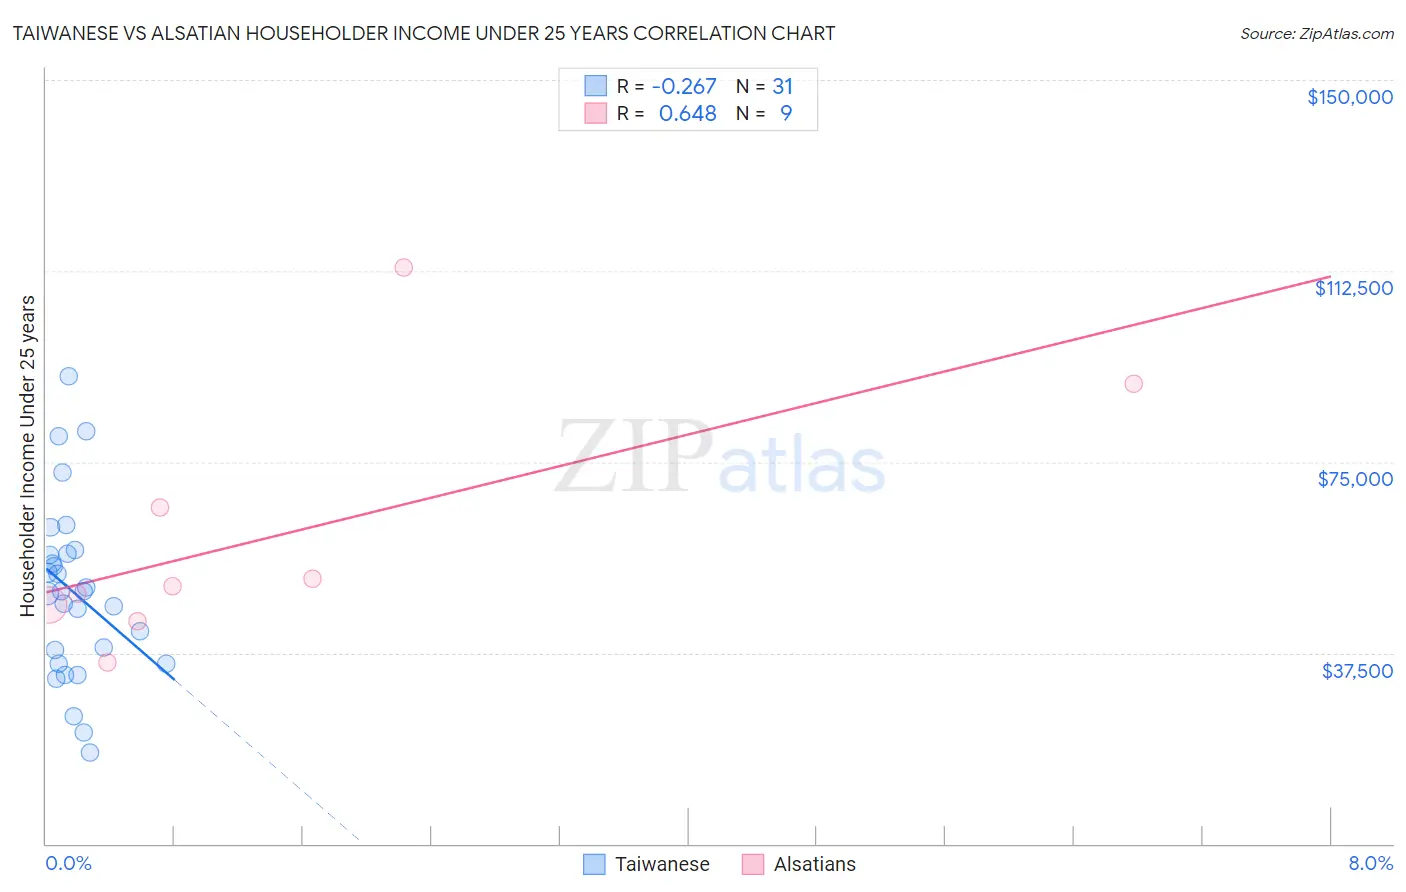
Taiwanese vs Alsatian Householder Income Under 25 years Correlation Chart
The statistical analysis conducted on geographies consisting of 31,064,983 people shows a weak negative correlation between the proportion of Taiwanese and household income with householder under the age of 25 in the United States with a correlation coefficient (R) of -0.267 and weighted average of $49,804. Similarly, the statistical analysis conducted on geographies consisting of 77,564,981 people shows a significant positive correlation between the proportion of Alsatians and household income with householder under the age of 25 in the United States with a correlation coefficient (R) of 0.648 and weighted average of $49,267, a difference of 1.1%.
Householder Income Under 25 years Correlation Summary
| Measurement | Taiwanese | Alsatian |
| Minimum | $17,865 | $35,598 |
| Maximum | $91,771 | $113,281 |
| Range | $73,906 | $77,683 |
| Mean | $49,314 | $60,844 |
| Median | $49,614 | $50,662 |
| Interquartile 25% (IQ1) | $35,417 | $45,251 |
| Interquartile 75% (IQ3) | $56,998 | $78,194 |
| Interquartile Range (IQR) | $21,581 | $32,943 |
| Standard Deviation (Sample) | $17,111 | $25,229 |
| Standard Deviation (Population) | $16,833 | $23,786 |
Demographics Similar to Taiwanese and Alsatians by Householder Income Under 25 years
In terms of householder income under 25 years, the demographic groups most similar to Taiwanese are Colville ($49,774, a difference of 0.060%), Slovak ($49,753, a difference of 0.10%), Immigrants from Senegal ($49,742, a difference of 0.12%), Immigrants from Kenya ($49,633, a difference of 0.34%), and Dominican ($49,633, a difference of 0.34%). Similarly, the demographic groups most similar to Alsatians are Nonimmigrants ($49,348, a difference of 0.16%), Immigrants from Nigeria ($49,174, a difference of 0.19%), Hmong ($49,364, a difference of 0.20%), Apache ($49,395, a difference of 0.26%), and Nigerian ($49,416, a difference of 0.30%).
| Demographics | Rating | Rank | Householder Income Under 25 years |
| Immigrants | Venezuela | 0.6 /100 | #266 | Tragic $50,109 |
| Immigrants | Laos | 0.5 /100 | #267 | Tragic $50,041 |
| Venezuelans | 0.5 /100 | #268 | Tragic $50,011 |
| Ute | 0.5 /100 | #269 | Tragic $49,997 |
| Mexicans | 0.5 /100 | #270 | Tragic $49,989 |
| Taiwanese | 0.3 /100 | #271 | Tragic $49,804 |
| Colville | 0.3 /100 | #272 | Tragic $49,774 |
| Slovaks | 0.3 /100 | #273 | Tragic $49,753 |
| Immigrants | Senegal | 0.3 /100 | #274 | Tragic $49,742 |
| Immigrants | Kenya | 0.2 /100 | #275 | Tragic $49,633 |
| Dominicans | 0.2 /100 | #276 | Tragic $49,633 |
| Immigrants | Western Africa | 0.2 /100 | #277 | Tragic $49,621 |
| Nigerians | 0.1 /100 | #278 | Tragic $49,416 |
| Apache | 0.1 /100 | #279 | Tragic $49,395 |
| Hmong | 0.1 /100 | #280 | Tragic $49,364 |
| Immigrants | Nonimmigrants | 0.1 /100 | #281 | Tragic $49,348 |
| Alsatians | 0.1 /100 | #282 | Tragic $49,267 |
| Immigrants | Nigeria | 0.1 /100 | #283 | Tragic $49,174 |
| Carpatho Rusyns | 0.1 /100 | #284 | Tragic $49,113 |
| Scotch-Irish | 0.0 /100 | #285 | Tragic $49,039 |
| French American Indians | 0.0 /100 | #286 | Tragic $48,977 |