Indian (Asian) vs Laotian Median Earnings
COMPARE
Indian (Asian)
Laotian
Median Earnings
Median Earnings Comparison
Indians (Asian)
Laotians
$56,253
MEDIAN EARNINGS
100.0/ 100
METRIC RATING
15th/ 347
METRIC RANK
$50,343
MEDIAN EARNINGS
99.6/ 100
METRIC RATING
79th/ 347
METRIC RANK
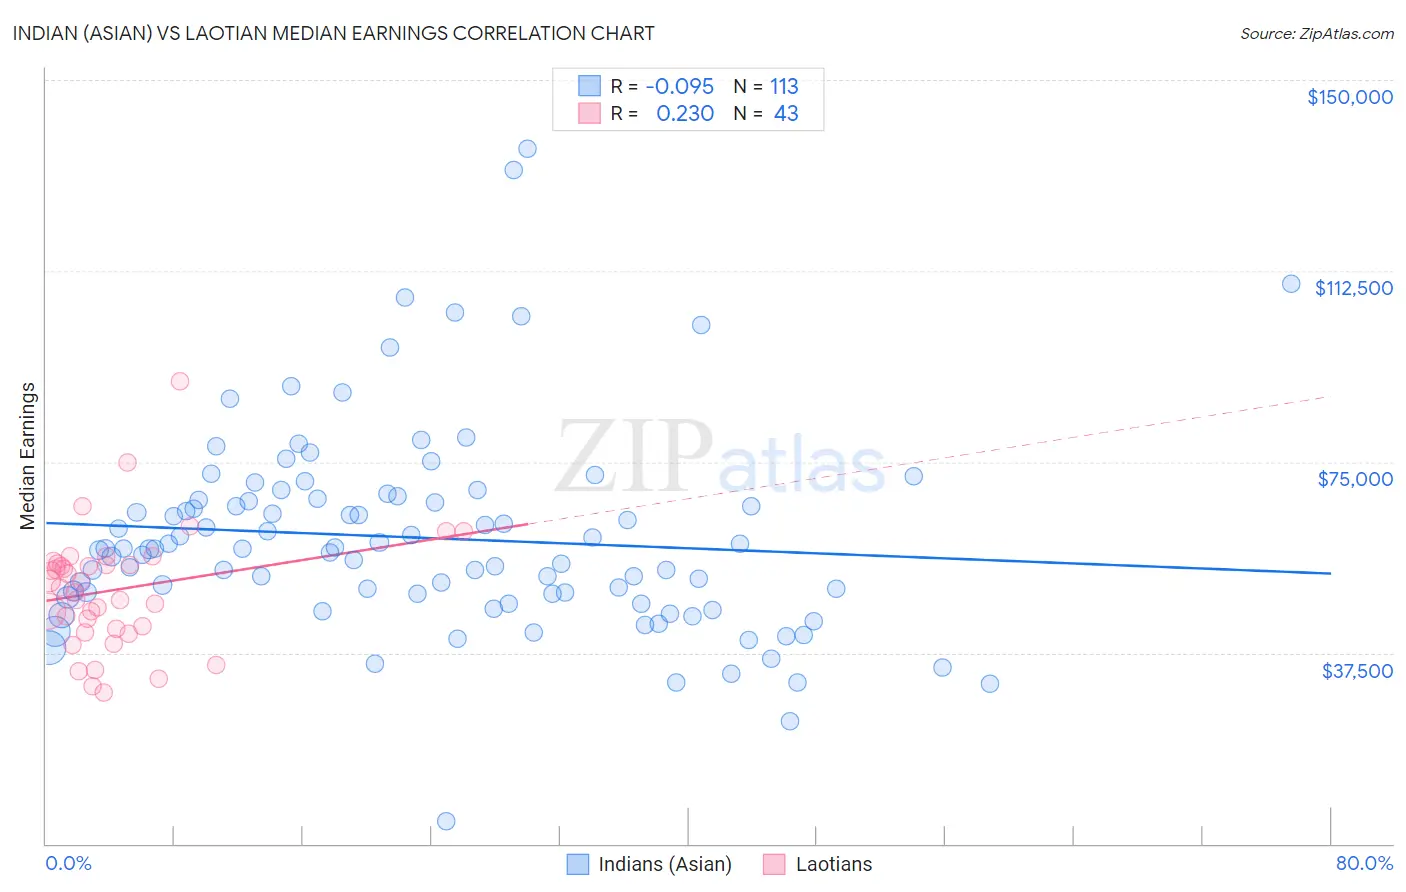
Indian (Asian) vs Laotian Median Earnings Correlation Chart
The statistical analysis conducted on geographies consisting of 495,313,309 people shows a slight negative correlation between the proportion of Indians (Asian) and median earnings in the United States with a correlation coefficient (R) of -0.095 and weighted average of $56,253. Similarly, the statistical analysis conducted on geographies consisting of 224,848,117 people shows a weak positive correlation between the proportion of Laotians and median earnings in the United States with a correlation coefficient (R) of 0.230 and weighted average of $50,343, a difference of 11.7%.
Median Earnings Correlation Summary
| Measurement | Indian (Asian) | Laotian |
| Minimum | $4,382 | $29,751 |
| Maximum | $136,388 | $90,729 |
| Range | $132,006 | $60,978 |
| Mean | $60,085 | $49,880 |
| Median | $57,869 | $50,359 |
| Interquartile 25% (IQ1) | $48,728 | $42,206 |
| Interquartile 75% (IQ3) | $67,622 | $55,106 |
| Interquartile Range (IQR) | $18,894 | $12,900 |
| Standard Deviation (Sample) | $20,110 | $11,670 |
| Standard Deviation (Population) | $20,020 | $11,533 |
Similar Demographics by Median Earnings
Demographics Similar to Indians (Asian) by Median Earnings
In terms of median earnings, the demographic groups most similar to Indians (Asian) are Immigrants from Australia ($56,305, a difference of 0.090%), Immigrants from Eastern Asia ($56,183, a difference of 0.12%), Immigrants from China ($56,638, a difference of 0.68%), Immigrants from Ireland ($56,854, a difference of 1.1%), and Immigrants from Israel ($57,034, a difference of 1.4%).
| Demographics | Rating | Rank | Median Earnings |
| Immigrants | Iran | 100.0 /100 | #8 | Exceptional $57,612 |
| Okinawans | 100.0 /100 | #9 | Exceptional $57,550 |
| Immigrants | South Central Asia | 100.0 /100 | #10 | Exceptional $57,114 |
| Immigrants | Israel | 100.0 /100 | #11 | Exceptional $57,034 |
| Immigrants | Ireland | 100.0 /100 | #12 | Exceptional $56,854 |
| Immigrants | China | 100.0 /100 | #13 | Exceptional $56,638 |
| Immigrants | Australia | 100.0 /100 | #14 | Exceptional $56,305 |
| Indians (Asian) | 100.0 /100 | #15 | Exceptional $56,253 |
| Immigrants | Eastern Asia | 100.0 /100 | #16 | Exceptional $56,183 |
| Eastern Europeans | 100.0 /100 | #17 | Exceptional $55,084 |
| Immigrants | Japan | 100.0 /100 | #18 | Exceptional $54,938 |
| Immigrants | Belgium | 100.0 /100 | #19 | Exceptional $54,679 |
| Cypriots | 100.0 /100 | #20 | Exceptional $54,589 |
| Burmese | 100.0 /100 | #21 | Exceptional $54,559 |
| Immigrants | Korea | 100.0 /100 | #22 | Exceptional $54,530 |
Demographics Similar to Laotians by Median Earnings
In terms of median earnings, the demographic groups most similar to Laotians are Ukrainian ($50,320, a difference of 0.050%), Argentinean ($50,399, a difference of 0.11%), Immigrants from Southern Europe ($50,280, a difference of 0.12%), Immigrants from Moldova ($50,274, a difference of 0.14%), and Romanian ($50,244, a difference of 0.20%).
| Demographics | Rating | Rank | Median Earnings |
| Immigrants | Egypt | 99.8 /100 | #72 | Exceptional $50,901 |
| Immigrants | Netherlands | 99.8 /100 | #73 | Exceptional $50,818 |
| South Africans | 99.8 /100 | #74 | Exceptional $50,752 |
| Immigrants | Scotland | 99.8 /100 | #75 | Exceptional $50,741 |
| Immigrants | Italy | 99.7 /100 | #76 | Exceptional $50,581 |
| Immigrants | Western Europe | 99.7 /100 | #77 | Exceptional $50,549 |
| Argentineans | 99.6 /100 | #78 | Exceptional $50,399 |
| Laotians | 99.6 /100 | #79 | Exceptional $50,343 |
| Ukrainians | 99.6 /100 | #80 | Exceptional $50,320 |
| Immigrants | Southern Europe | 99.6 /100 | #81 | Exceptional $50,280 |
| Immigrants | Moldova | 99.5 /100 | #82 | Exceptional $50,274 |
| Romanians | 99.5 /100 | #83 | Exceptional $50,244 |
| Immigrants | Hungary | 99.5 /100 | #84 | Exceptional $50,227 |
| Immigrants | Kazakhstan | 99.5 /100 | #85 | Exceptional $50,225 |
| Immigrants | Canada | 99.5 /100 | #86 | Exceptional $50,192 |