Jamaican vs Laotian Median Earnings
COMPARE
Jamaican
Laotian
Median Earnings
Median Earnings Comparison
Jamaicans
Laotians
$43,343
MEDIAN EARNINGS
1.3/ 100
METRIC RATING
257th/ 347
METRIC RANK
$50,343
MEDIAN EARNINGS
99.6/ 100
METRIC RATING
79th/ 347
METRIC RANK
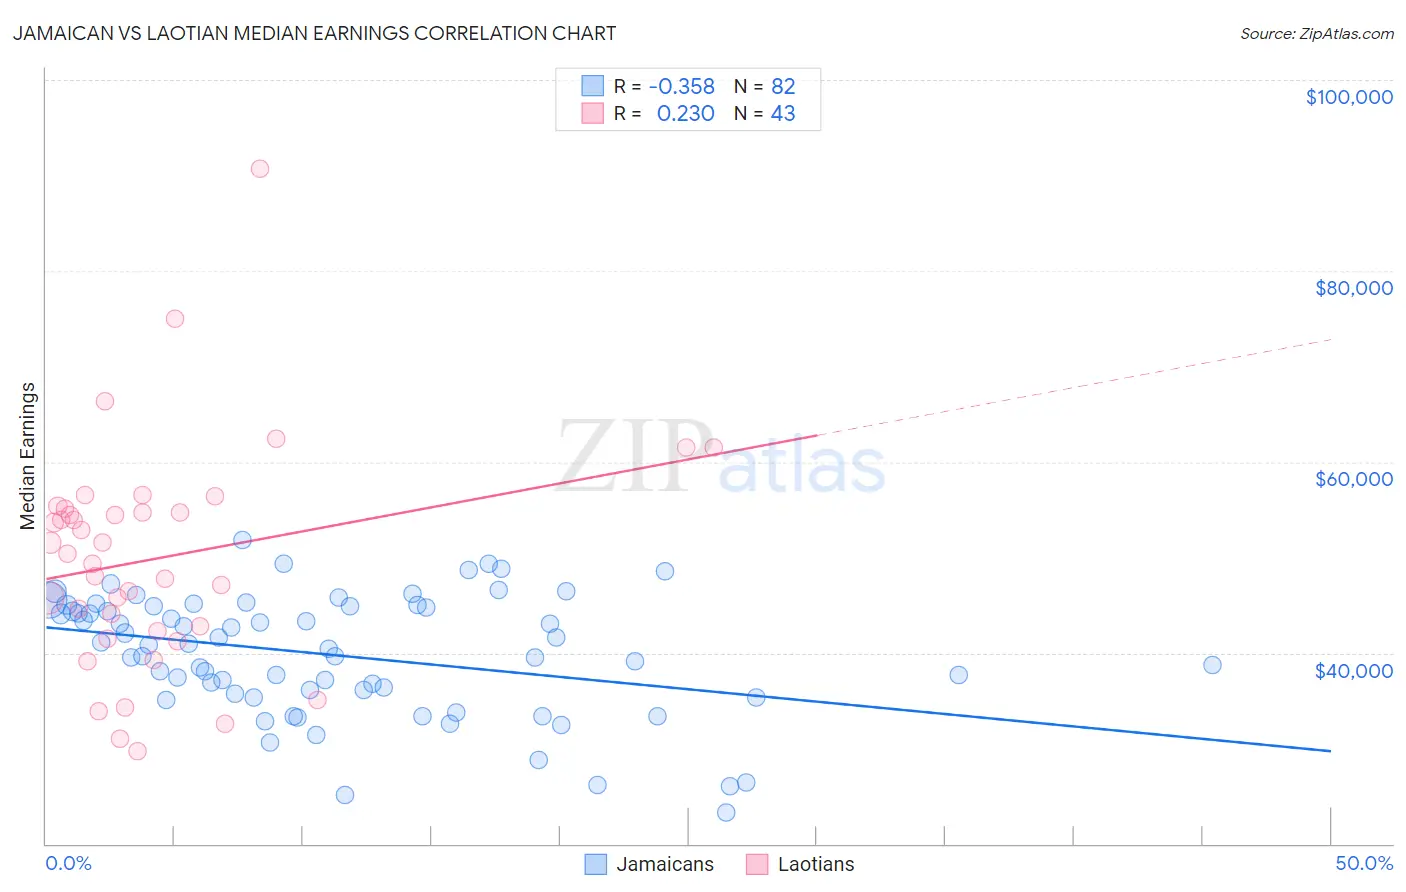
Jamaican vs Laotian Median Earnings Correlation Chart
The statistical analysis conducted on geographies consisting of 368,067,864 people shows a mild negative correlation between the proportion of Jamaicans and median earnings in the United States with a correlation coefficient (R) of -0.358 and weighted average of $43,343. Similarly, the statistical analysis conducted on geographies consisting of 224,848,117 people shows a weak positive correlation between the proportion of Laotians and median earnings in the United States with a correlation coefficient (R) of 0.230 and weighted average of $50,343, a difference of 16.2%.
Median Earnings Correlation Summary
| Measurement | Jamaican | Laotian |
| Minimum | $23,316 | $29,751 |
| Maximum | $51,789 | $90,729 |
| Range | $28,473 | $60,978 |
| Mean | $39,739 | $49,880 |
| Median | $40,605 | $50,359 |
| Interquartile 25% (IQ1) | $35,749 | $42,206 |
| Interquartile 75% (IQ3) | $44,901 | $55,106 |
| Interquartile Range (IQR) | $9,152 | $12,900 |
| Standard Deviation (Sample) | $6,295 | $11,670 |
| Standard Deviation (Population) | $6,257 | $11,533 |
Similar Demographics by Median Earnings
Demographics Similar to Jamaicans by Median Earnings
In terms of median earnings, the demographic groups most similar to Jamaicans are French American Indian ($43,333, a difference of 0.020%), Alaskan Athabascan ($43,393, a difference of 0.12%), Immigrants from Middle Africa ($43,416, a difference of 0.17%), German Russian ($43,200, a difference of 0.33%), and Liberian ($43,536, a difference of 0.45%).
| Demographics | Rating | Rank | Median Earnings |
| Alaska Natives | 2.3 /100 | #250 | Tragic $43,750 |
| Tsimshian | 2.1 /100 | #251 | Tragic $43,695 |
| Hawaiians | 2.0 /100 | #252 | Tragic $43,673 |
| Somalis | 1.8 /100 | #253 | Tragic $43,567 |
| Liberians | 1.7 /100 | #254 | Tragic $43,536 |
| Immigrants | Middle Africa | 1.4 /100 | #255 | Tragic $43,416 |
| Alaskan Athabascans | 1.4 /100 | #256 | Tragic $43,393 |
| Jamaicans | 1.3 /100 | #257 | Tragic $43,343 |
| French American Indians | 1.3 /100 | #258 | Tragic $43,333 |
| German Russians | 1.1 /100 | #259 | Tragic $43,200 |
| Immigrants | Somalia | 0.9 /100 | #260 | Tragic $43,100 |
| Immigrants | Jamaica | 0.8 /100 | #261 | Tragic $43,026 |
| Nicaraguans | 0.8 /100 | #262 | Tragic $43,026 |
| Inupiat | 0.8 /100 | #263 | Tragic $43,000 |
| Immigrants | Liberia | 0.7 /100 | #264 | Tragic $42,923 |
Demographics Similar to Laotians by Median Earnings
In terms of median earnings, the demographic groups most similar to Laotians are Ukrainian ($50,320, a difference of 0.050%), Argentinean ($50,399, a difference of 0.11%), Immigrants from Southern Europe ($50,280, a difference of 0.12%), Immigrants from Moldova ($50,274, a difference of 0.14%), and Romanian ($50,244, a difference of 0.20%).
| Demographics | Rating | Rank | Median Earnings |
| Immigrants | Egypt | 99.8 /100 | #72 | Exceptional $50,901 |
| Immigrants | Netherlands | 99.8 /100 | #73 | Exceptional $50,818 |
| South Africans | 99.8 /100 | #74 | Exceptional $50,752 |
| Immigrants | Scotland | 99.8 /100 | #75 | Exceptional $50,741 |
| Immigrants | Italy | 99.7 /100 | #76 | Exceptional $50,581 |
| Immigrants | Western Europe | 99.7 /100 | #77 | Exceptional $50,549 |
| Argentineans | 99.6 /100 | #78 | Exceptional $50,399 |
| Laotians | 99.6 /100 | #79 | Exceptional $50,343 |
| Ukrainians | 99.6 /100 | #80 | Exceptional $50,320 |
| Immigrants | Southern Europe | 99.6 /100 | #81 | Exceptional $50,280 |
| Immigrants | Moldova | 99.5 /100 | #82 | Exceptional $50,274 |
| Romanians | 99.5 /100 | #83 | Exceptional $50,244 |
| Immigrants | Hungary | 99.5 /100 | #84 | Exceptional $50,227 |
| Immigrants | Kazakhstan | 99.5 /100 | #85 | Exceptional $50,225 |
| Immigrants | Canada | 99.5 /100 | #86 | Exceptional $50,192 |