Armenian vs Immigrants from Western Europe Median Family Income
COMPARE
Armenian
Immigrants from Western Europe
Median Family Income
Median Family Income Comparison
Armenians
Immigrants from Western Europe
$109,692
MEDIAN FAMILY INCOME
97.3/ 100
METRIC RATING
99th/ 347
METRIC RANK
$112,688
MEDIAN FAMILY INCOME
99.4/ 100
METRIC RATING
75th/ 347
METRIC RANK
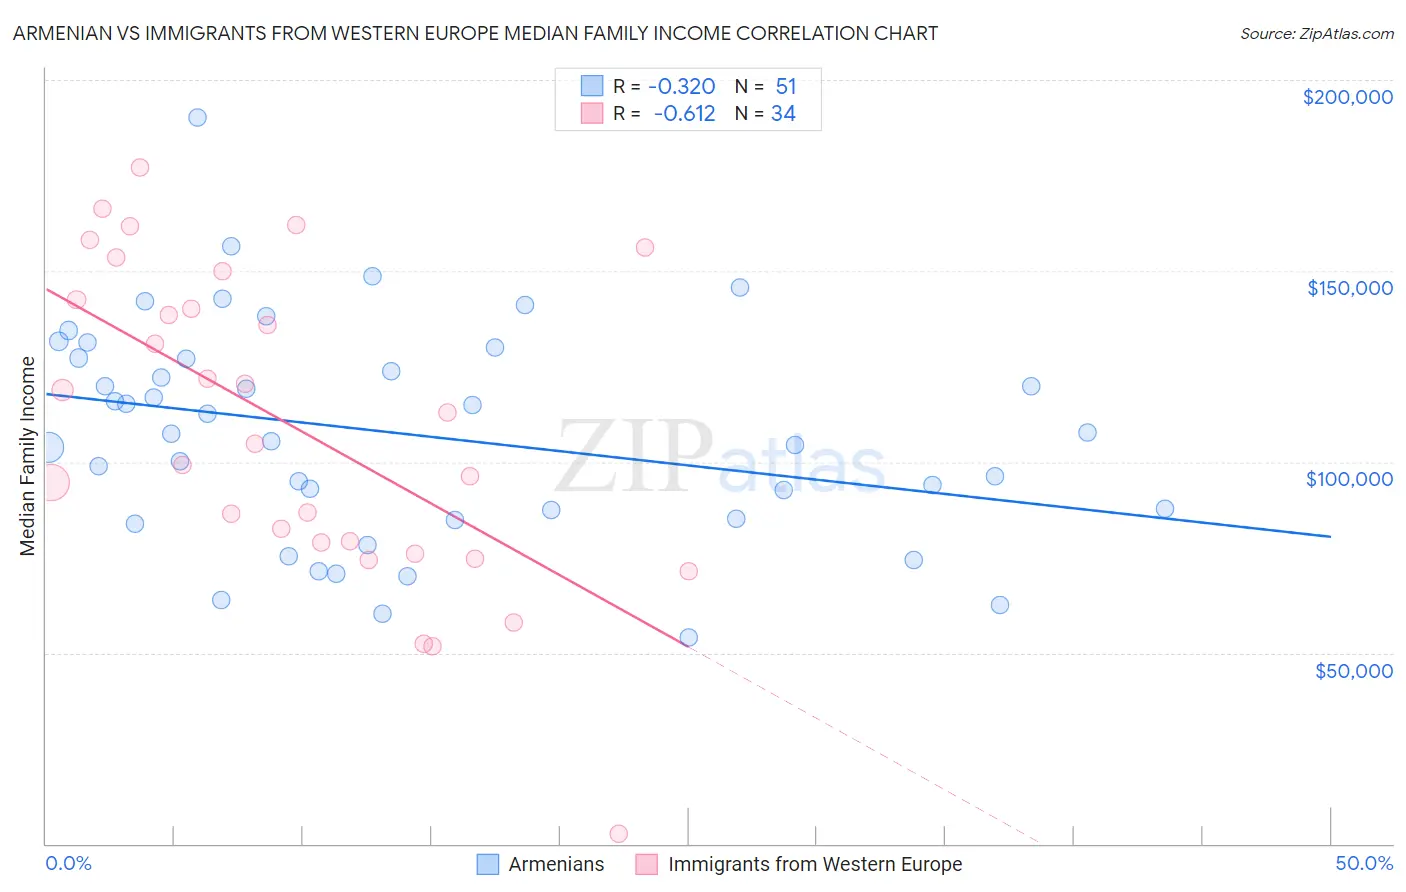
Armenian vs Immigrants from Western Europe Median Family Income Correlation Chart
The statistical analysis conducted on geographies consisting of 310,689,637 people shows a mild negative correlation between the proportion of Armenians and median family income in the United States with a correlation coefficient (R) of -0.320 and weighted average of $109,692. Similarly, the statistical analysis conducted on geographies consisting of 493,641,524 people shows a significant negative correlation between the proportion of Immigrants from Western Europe and median family income in the United States with a correlation coefficient (R) of -0.612 and weighted average of $112,688, a difference of 2.7%.
Median Family Income Correlation Summary
| Measurement | Armenian | Immigrants from Western Europe |
| Minimum | $54,063 | $2,499 |
| Maximum | $190,202 | $177,105 |
| Range | $136,139 | $174,606 |
| Mean | $107,343 | $109,288 |
| Median | $107,236 | $108,868 |
| Interquartile 25% (IQ1) | $85,128 | $78,809 |
| Interquartile 75% (IQ3) | $127,200 | $142,425 |
| Interquartile Range (IQR) | $42,071 | $63,615 |
| Standard Deviation (Sample) | $28,557 | $41,087 |
| Standard Deviation (Population) | $28,276 | $40,478 |
Similar Demographics by Median Family Income
Demographics Similar to Armenians by Median Family Income
In terms of median family income, the demographic groups most similar to Armenians are Macedonian ($109,668, a difference of 0.020%), Immigrants from Kuwait ($109,731, a difference of 0.040%), Immigrants from Ukraine ($109,645, a difference of 0.040%), Assyrian/Chaldean/Syriac ($109,622, a difference of 0.060%), and Jordanian ($109,865, a difference of 0.16%).
| Demographics | Rating | Rank | Median Family Income |
| Immigrants | Lebanon | 97.9 /100 | #92 | Exceptional $110,159 |
| Immigrants | Kazakhstan | 97.8 /100 | #93 | Exceptional $110,137 |
| Koreans | 97.8 /100 | #94 | Exceptional $110,103 |
| Zimbabweans | 97.7 /100 | #95 | Exceptional $110,011 |
| Immigrants | Moldova | 97.7 /100 | #96 | Exceptional $109,975 |
| Jordanians | 97.5 /100 | #97 | Exceptional $109,865 |
| Immigrants | Kuwait | 97.4 /100 | #98 | Exceptional $109,731 |
| Armenians | 97.3 /100 | #99 | Exceptional $109,692 |
| Macedonians | 97.3 /100 | #100 | Exceptional $109,668 |
| Immigrants | Ukraine | 97.2 /100 | #101 | Exceptional $109,645 |
| Assyrians/Chaldeans/Syriacs | 97.2 /100 | #102 | Exceptional $109,622 |
| Immigrants | Brazil | 96.9 /100 | #103 | Exceptional $109,418 |
| Palestinians | 96.9 /100 | #104 | Exceptional $109,413 |
| Syrians | 96.7 /100 | #105 | Exceptional $109,299 |
| Albanians | 96.4 /100 | #106 | Exceptional $109,136 |
Demographics Similar to Immigrants from Western Europe by Median Family Income
In terms of median family income, the demographic groups most similar to Immigrants from Western Europe are Argentinean ($112,665, a difference of 0.020%), Immigrants from Italy ($112,848, a difference of 0.14%), Immigrants from Eastern Europe ($112,527, a difference of 0.14%), Laotian ($112,859, a difference of 0.15%), and Afghan ($112,971, a difference of 0.25%).
| Demographics | Rating | Rank | Median Family Income |
| Immigrants | Serbia | 99.6 /100 | #68 | Exceptional $113,463 |
| Immigrants | Bulgaria | 99.6 /100 | #69 | Exceptional $113,461 |
| Immigrants | Romania | 99.6 /100 | #70 | Exceptional $113,434 |
| South Africans | 99.5 /100 | #71 | Exceptional $113,229 |
| Afghans | 99.5 /100 | #72 | Exceptional $112,971 |
| Laotians | 99.5 /100 | #73 | Exceptional $112,859 |
| Immigrants | Italy | 99.4 /100 | #74 | Exceptional $112,848 |
| Immigrants | Western Europe | 99.4 /100 | #75 | Exceptional $112,688 |
| Argentineans | 99.4 /100 | #76 | Exceptional $112,665 |
| Immigrants | Eastern Europe | 99.4 /100 | #77 | Exceptional $112,527 |
| Immigrants | Canada | 99.3 /100 | #78 | Exceptional $112,374 |
| Italians | 99.3 /100 | #79 | Exceptional $112,372 |
| Immigrants | Croatia | 99.3 /100 | #80 | Exceptional $112,323 |
| Immigrants | North America | 99.2 /100 | #81 | Exceptional $112,151 |
| Immigrants | England | 99.2 /100 | #82 | Exceptional $112,038 |