Malaysian vs Immigrants from Western Europe Median Family Income
COMPARE
Malaysian
Immigrants from Western Europe
Median Family Income
Median Family Income Comparison
Malaysians
Immigrants from Western Europe
$95,230
MEDIAN FAMILY INCOME
2.2/ 100
METRIC RATING
230th/ 347
METRIC RANK
$112,688
MEDIAN FAMILY INCOME
99.4/ 100
METRIC RATING
75th/ 347
METRIC RANK
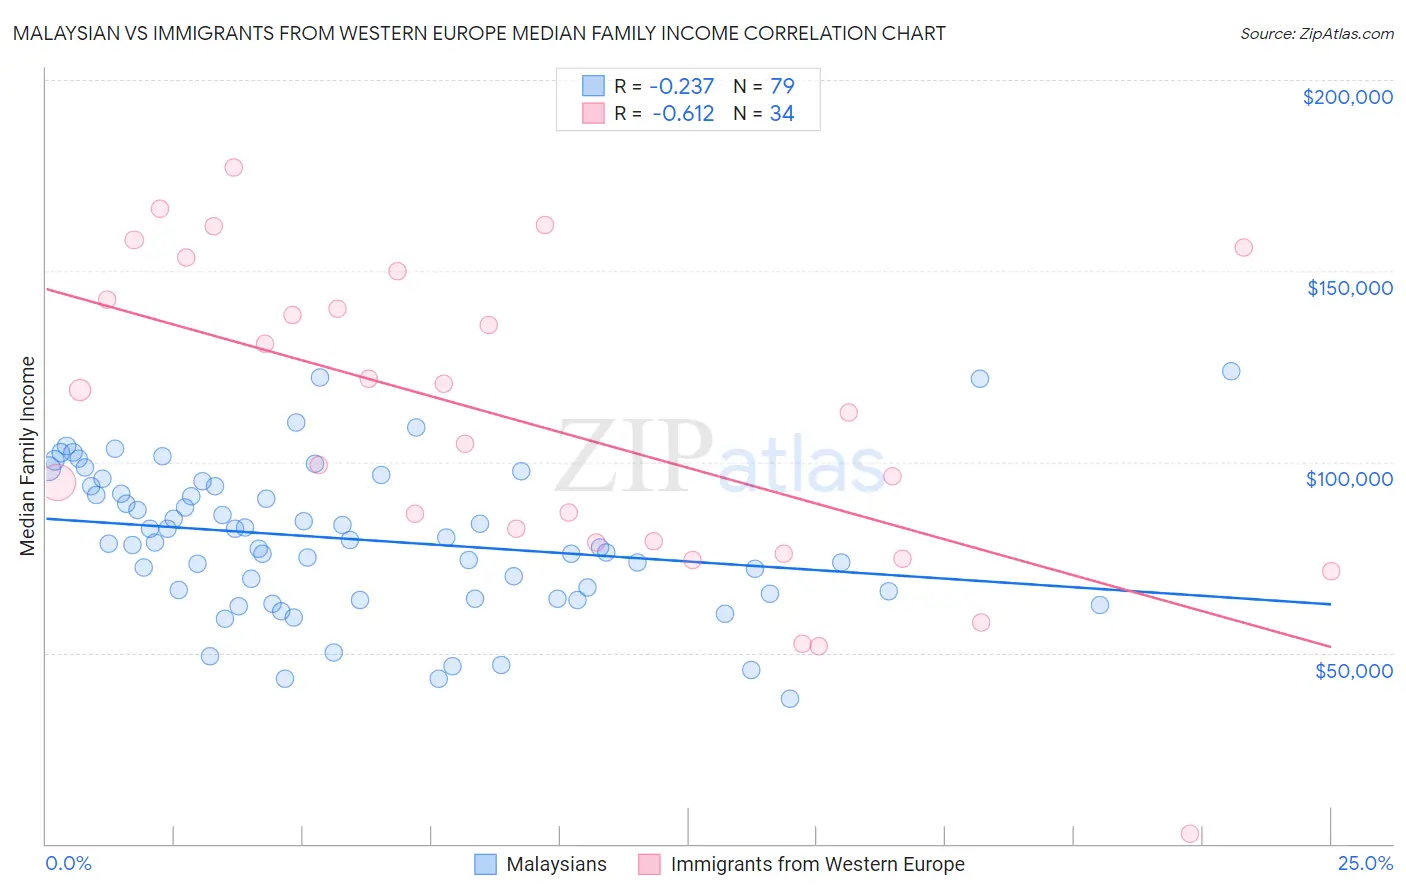
Malaysian vs Immigrants from Western Europe Median Family Income Correlation Chart
The statistical analysis conducted on geographies consisting of 225,953,352 people shows a weak negative correlation between the proportion of Malaysians and median family income in the United States with a correlation coefficient (R) of -0.237 and weighted average of $95,230. Similarly, the statistical analysis conducted on geographies consisting of 493,641,524 people shows a significant negative correlation between the proportion of Immigrants from Western Europe and median family income in the United States with a correlation coefficient (R) of -0.612 and weighted average of $112,688, a difference of 18.3%.
Median Family Income Correlation Summary
| Measurement | Malaysian | Immigrants from Western Europe |
| Minimum | $38,021 | $2,499 |
| Maximum | $123,750 | $177,105 |
| Range | $85,729 | $174,606 |
| Mean | $79,701 | $109,288 |
| Median | $78,842 | $108,868 |
| Interquartile 25% (IQ1) | $65,625 | $78,809 |
| Interquartile 75% (IQ3) | $93,739 | $142,425 |
| Interquartile Range (IQR) | $28,114 | $63,615 |
| Standard Deviation (Sample) | $19,147 | $41,087 |
| Standard Deviation (Population) | $19,025 | $40,478 |
Similar Demographics by Median Family Income
Demographics Similar to Malaysians by Median Family Income
In terms of median family income, the demographic groups most similar to Malaysians are Marshallese ($95,293, a difference of 0.070%), Ecuadorian ($95,114, a difference of 0.12%), Immigrants from the Azores ($95,402, a difference of 0.18%), Immigrants from Venezuela ($94,904, a difference of 0.34%), and Alaska Native ($95,573, a difference of 0.36%).
| Demographics | Rating | Rank | Median Family Income |
| Venezuelans | 3.7 /100 | #223 | Tragic $96,281 |
| Immigrants | Nonimmigrants | 3.6 /100 | #224 | Tragic $96,231 |
| Vietnamese | 3.4 /100 | #225 | Tragic $96,123 |
| Immigrants | Panama | 2.7 /100 | #226 | Tragic $95,647 |
| Alaska Natives | 2.6 /100 | #227 | Tragic $95,573 |
| Immigrants | Azores | 2.4 /100 | #228 | Tragic $95,402 |
| Marshallese | 2.2 /100 | #229 | Tragic $95,293 |
| Malaysians | 2.2 /100 | #230 | Tragic $95,230 |
| Ecuadorians | 2.1 /100 | #231 | Tragic $95,114 |
| Immigrants | Venezuela | 1.9 /100 | #232 | Tragic $94,904 |
| Immigrants | Bangladesh | 1.6 /100 | #233 | Tragic $94,665 |
| Immigrants | Western Africa | 1.6 /100 | #234 | Tragic $94,638 |
| Immigrants | Burma/Myanmar | 1.5 /100 | #235 | Tragic $94,472 |
| Trinidadians and Tobagonians | 1.5 /100 | #236 | Tragic $94,466 |
| Alaskan Athabascans | 1.5 /100 | #237 | Tragic $94,429 |
Demographics Similar to Immigrants from Western Europe by Median Family Income
In terms of median family income, the demographic groups most similar to Immigrants from Western Europe are Argentinean ($112,665, a difference of 0.020%), Immigrants from Italy ($112,848, a difference of 0.14%), Immigrants from Eastern Europe ($112,527, a difference of 0.14%), Laotian ($112,859, a difference of 0.15%), and Afghan ($112,971, a difference of 0.25%).
| Demographics | Rating | Rank | Median Family Income |
| Immigrants | Serbia | 99.6 /100 | #68 | Exceptional $113,463 |
| Immigrants | Bulgaria | 99.6 /100 | #69 | Exceptional $113,461 |
| Immigrants | Romania | 99.6 /100 | #70 | Exceptional $113,434 |
| South Africans | 99.5 /100 | #71 | Exceptional $113,229 |
| Afghans | 99.5 /100 | #72 | Exceptional $112,971 |
| Laotians | 99.5 /100 | #73 | Exceptional $112,859 |
| Immigrants | Italy | 99.4 /100 | #74 | Exceptional $112,848 |
| Immigrants | Western Europe | 99.4 /100 | #75 | Exceptional $112,688 |
| Argentineans | 99.4 /100 | #76 | Exceptional $112,665 |
| Immigrants | Eastern Europe | 99.4 /100 | #77 | Exceptional $112,527 |
| Immigrants | Canada | 99.3 /100 | #78 | Exceptional $112,374 |
| Italians | 99.3 /100 | #79 | Exceptional $112,372 |
| Immigrants | Croatia | 99.3 /100 | #80 | Exceptional $112,323 |
| Immigrants | North America | 99.2 /100 | #81 | Exceptional $112,151 |
| Immigrants | England | 99.2 /100 | #82 | Exceptional $112,038 |